


The huge US trade deficit improved – or got less horrible, we might say – by 19% in 2023, with exports of goods and services rising to $3.05 trillion, and with imports of goods and services falling sharply to $3.83 trillion, producing the least horrible trade deficit since 2020, of $773 billion. The US trade deficit with China and Hong Kong was cut by 29%, as other countries such as Vietnam and Mexico picked up some of the trade. As we discussed in detail the other day, it’s a good thing that trade finally improves, and it was a major contributor to the surprisingly strong GDP in 2023.
Despite the horrible trade deficit, the US still exported over $2 trillion of goods alone – not counting services – amounting to roughly half the GDP of Germany. Those exports added $2 trillion to US GDP in 2023. Those are big numbers. But the US is a huge economy, and it doesn’t export enough, given the size of its economy; and it imports way too much.
The biggest US export products.
Industrial supplies and materials include crude oil, petroleum products, natural gas, and petrochemical products that together amounted to $466 billion in exports in 2023, but that was down by 13% from 2022 when $534 billion of the products were exported, amid the 50% surge that year. These products are the largest line items in the overall category “Industrial supplies and materials.” Some of the spike and retracement are related to the sharp movements in prices.
The US has become the largest producer of crude oil, petroleum products, and natural gas in the world, drill baby drill, and it has a large petrochemical industry, and exports large amounts of those products.
| Industrial supplies and materials | 2023 | 2022 | % change |
| Total, in billion $ | 728.0 | 830.8 | -12.4% |
| Top products: | |||
| Crude oil | 116.9 | 119.1 | -1.9% |
| Other petroleum products | 77.3 | 91.2 | -15.2% |
| Fuel oil | 47.9 | 58.5 | -18.1% |
| Plastic materials | 44.8 | 50.2 | -10.8% |
| Natural gas | 42.0 | 63.1 | -33.5% |
| Other chemicals | 39.5 | 42.0 | -6.0% |
| Organic chemicals | 34.6 | 39.8 | -13.1% |
| Other industrial supplies | 32.9 | 32.6 | 1.1% |
| Natural gas liquids | 30.9 | 38.0 | -18.7% |
| Nonmonetary gold | 29.6 | 40.1 | -26.3% |
| Finished metal shapes | 25.8 | 25.4 | 1.6% |
| Newsprint | 12.6 | 14.7 | -14.2% |
| Precious metals, other | 12.3 | 18.8 | -34.5% |
| Iron and steel mill products | 12.2 | 12.0 | 1.5% |
| Coal and fuels, other | 11.9 | 11.8 | 1.4% |
| Inorganic chemicals | 11.9 | 13.3 | -10.3% |
| Fertilizers, pesticides, and insecticides | 11.1 | 15.9 | -30.2% |
| Metallurgical grade coal | 11.0 | 13.6 | -19.2% |
| Copper | 10.0 | 9.7 | 3.6% |
“Capital goods except automotive” was the #1 export category until the export surge of crude oil, petroleum products, natural gas, and petrochemical products took over.
| Capital goods, except automotive | 2023 | 2022 | % change |
| Total, in billion $ | 601.2 | 572.7 | 5.0% |
| Top products: | |||
| Other industrial machinery | 68.8 | 73.9 | -6.8% |
| Semiconductors | 57.1 | 66.5 | -14.1% |
| Civilian aircraft engines | 53.8 | 44.9 | 19.9% |
| Electric apparatus | 53.2 | 49.2 | 8.1% |
| Medical equipment | 46.4 | 42.8 | 8.3% |
| Telecommunications equipment | 39.1 | 34.6 | 13.0% |
| Civilian aircraft | 35.9 | 29.2 | 23.0% |
| Industrial engines | 29.6 | 26.8 | 10.8% |
| Computer accessories | 29.1 | 31.5 | -7.7% |
| Measuring, testing, control instruments | 28.8 | 27.6 | 4.5% |
| Civilian aircraft parts | 23.8 | 20.3 | 17.0% |
| Computers | 19.7 | 18.4 | 7.1% |
| Generators, accessories | 15.1 | 14.0 | 8.5% |
| Materials handling equipment | 14.4 | 13.2 | 8.8% |
| Laboratory testing instruments | 14.1 | 13.9 | 1.7% |
| Excavating machinery | 13.2 | 12.1 | 9.0% |
| Agricultural machinery, equipment | 11.0 | 10.0 | 9.7% |
| Photo, service industry machinery | 10.9 | 10.5 | 4.1% |
| Metalworking machine tools | 7.5 | 6.9 | 9.1% |
“Consumer goods” exports are dominated by pharmaceutical preparations, and those exports have soared by 70% since 2019.
| Consumer goods | 2023 | 2022 | % change |
| Total, in billion $ | 260.4 | 245.7 | 6.0% |
| Top products: | |||
| Pharmaceutical preparations | 102.0 | 89.3 | 14.2% |
| Cell phones and other household goods | 33.2 | 31.8 | 4.5% |
| Gem diamonds | 20.7 | 20.6 | 0.6% |
| Toiletries and cosmetics | 15.0 | 14.4 | 4.6% |
| Jewelry | 14.4 | 11.8 | 21.8% |
| Artwork and other collectibles | 11.3 | 11.1 | 2.2% |
| Toys, games, and sporting goods | 10.9 | 12.4 | -11.9% |
| Textile apparel and household goods | 8.2 | 8.4 | -2.3% |
“Automotive vehicles, parts, and engines” exports are dwarfed by imports of products in that category.
| Automotive vehicles, parts, and engines | 2023 | 2022 | % change |
| Total, in billion $ | 179.0 | 159.7 | 12.1% |
| Top products: | |||
| Other automotive parts and accessories | 62.8 | 54.7 | 14.9% |
| Passenger cars | 61.6 | 57.2 | 7.7% |
| Trucks, buses, and special purpose vehicles | 29.8 | 24.4 | 22.2% |
| Engines and engine parts | 21.3 | 20.1 | 6.0% |
“Foods, feeds, and beverages” exports vary widely from year to year, with some commodities jumping and others dropping. The year 2023 was complicated by low water on the Mississippi that restricted barge grain movements, particularly corn.
| Foods, feeds, and beverages | 2023 | 2022 | % change |
| Total, in billion $ | 162.5 | 179.9 | -9.7% |
| Top products: | |||
| Soybeans | 29.5 | 35.4 | -16.7% |
| Meat, poultry, etc. | 24.8 | 26.5 | -6.5% |
| Other foods | 17.5 | 17.8 | -1.4% |
| Corn | 14.3 | 19.8 | -27.5% |
| Animal feeds, n.e.c. | 13.1 | 12.4 | 5.4% |
| Nuts | 9.7 | 9.7 | 0.2% |
| Fruits, frozen juices | 8.7 | 8.6 | 0.8% |
| Vegetables | 7.9 | 7.5 | 5.9% |
| Bakery products | 7.7 | 7.1 | 8.0% |
| Dairy products and eggs | 6.6 | 8.0 | -16.8% |
| Wheat | 6.3 | 8.5 | -26.3% |
“Other goods” is everything else that gets exported that is not part of the five big categories.
| Other goods | 2023 | 2022 | % change |
| Total, in billion $ | 88.4 | 76.4 | 15.8% |
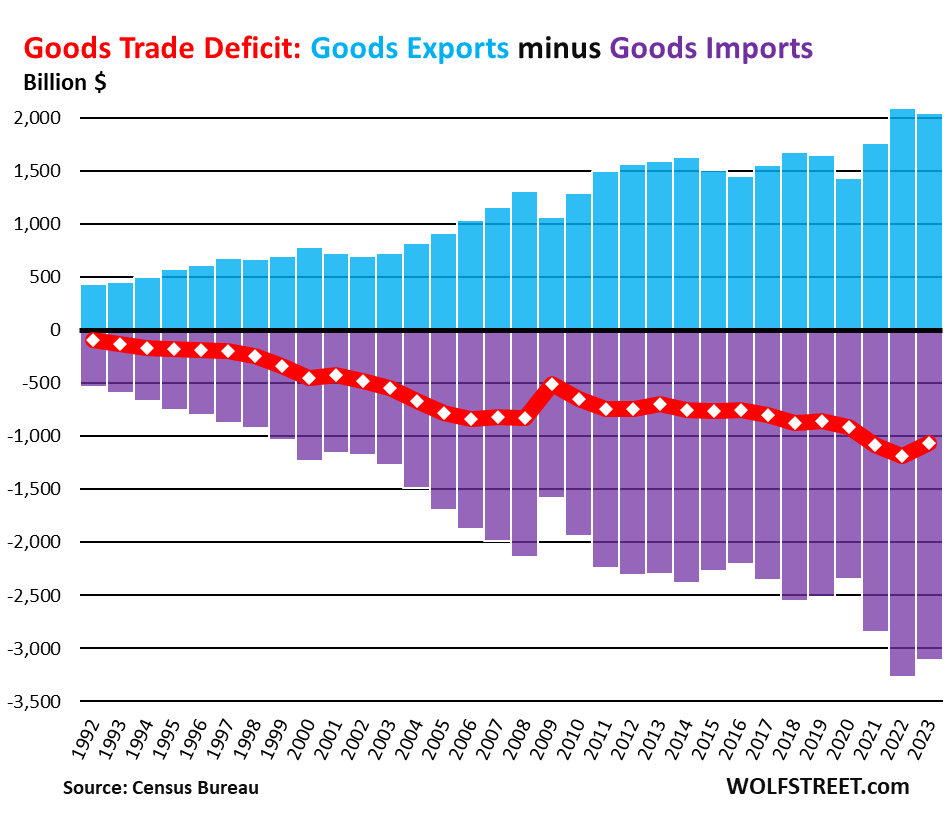
Exports minus imports: Step in the right direction.
Exports of goods (blue) fell by $39 billion to $2.05 trillion, as we discussed here. Imports of goods (purple) improved by $161 billion to $3.11 trillion. So the trade deficit in goods (red line) improved by $121 billion, to $1.06 trillion, the first major improvement since 2009.
Enjoy reading WOLF STREET and want to support it? You can donate. I appreciate it immensely. Click on the beer and iced-tea mug to find out how