


In modern software development, time is an incredibly valuable resource, especially during the compilation process. For developers working with CUDA C++ on large-scale GPU-accelerated applications, optimizing compile times can significantly enhance productivity and streamline the entire development cycle.
When using the nvcc compiler for offline compilation, efficient compilation times enable you to quickly build code and maintain momentum. In a just-in-time (JIT) compilation context using nvrtc, minimizing compile times helps reduce execution or runtime latency and improves application performance. If you work on real-time systems or interactive applications, you’ll benefit greatly from the fastest compile times possible.
Understanding where compilation bottlenecks come from is not always straightforward. The CUDA compilation process is complex, as the compiler performs a wide range of optimizations and transformations on the code, with little visibility into which parts of the code are taking a long time to compile.
For example, a seemingly simple line of code might trigger a complex template instantiation, leading to the recursive expansion of other templates, which in turn consumes a disproportionate amount of compile time. Without a clear view into what is happening behind the scenes, you don’t know what might be the root cause of the longer compilation times and whether it’s a deeply recursive template, a particularly large header file, or an inefficient code pattern.

The CUDA compilation flow is inherently complex. It’s not a single, monolithic process but a series of interconnected subprocesses. For instance, nvcc might invoke the host compiler, generate device-specific code, or run various optimization passes, each contributing to the overall compile time.
Without proper insight into the compilation process, it’s not easy to determine which of these subprocesses is leading to long compilation times. Is the slowdown happening during host-side compilation? Is a device-side optimization pass consuming too many cycles? Or is there something else entirely bogging down the process? This lack of transparency can leave you in the dark, unable to address the root causes of compile-time bottlenecks.
Given the complexities of the CUDA compilation pipeline, you’d benefit from a tool to analyze how your code interacts with the compiler. You need a way to measure the performance impact of your code on the compilation process and to identify which areas are ripe for optimization. This is where the --fdevice-time-trace feature for nvcc and nvrtc comes to play.
Released in CUDA 12.8, --fdevice-time-trace is a tool that provides a visual representation of the entire compilation process. It produces a detailed timeline of the various stages of compilation, giving you clear insights into where time is being spent.
Whether it’s a particularly expensive template instantiation or a time-consuming header file, --fdevice-time-trace breaks down the process and highlights the exact areas that are contributing to excessive compilation times. This level of visibility enables you to take control of your code’s impact on the compiler, paving the way for more efficient builds and faster development cycles.
In this post, we explore how this feature works, what insights it provides, and how it helps you optimize CUDA projects by identifying and mitigating compile-time bottlenecks.
Enabling the --fdevice-time-trace feature
To take advantage of the --fdevice-time-trace feature in the CUDA C++ compilers, enabling it is straightforward. For nvcc, the feature can be activated using the following command:
nvcc --fdevice-time-trace <output_filename> |
In this case, <output_filename> refers to the name of the file that is generated when the compilation completes. This produces a .json file that follows the “Trace Event” format, a widely recognized format used for profiling. The .json trace file can be opened and viewed in public viewers:
edge://tracing/chrome://tracing/- Perfetto interface
These tools provide a visual breakdown of the various stages of compilation, enabling you to analyze the compilation process step by step. Figure 1 shows how to open a trace .json file using chrome://tracing/.
about://tracingEnabling --fdevice-time-trace for large build systems
By default, the trace file covers a single invocation of nvcc. However, in real-world projects, you may want to capture traces across multiple compilation units or in large build systems where nvcc is invoked many times. To support this, nvcc offers the ability to generate a unique trace file for each compilation unit:
nvcc --fdevice-time-trace=- <input_file> |
When using this option, nvcc generates .json trace files using the same base name as the output file for each invocation, preventing manual trace file renaming. nvcc overwrites trace files if the output file name is reused, so that each trace corresponds to one invocation of the compiler.
Enabling --fdevice-time-trace for nvrtc
For just-in-time (JIT) compilation using nvrtc, enabling the --fdevice-time-trace feature is just as easy. When invoking nvrtcCompileProgram, pass the following option:
--fdevice-time-trace <output_filename> |
Unlike nvcc, nvrtc does not support --fdevice-time-trace=-. However, there is a special advantage: for programs that call nvrtcCompileProgram multiple times, which is common in JIT contexts, all the trace files are automatically appended. This enables you to use the same <output_filename> value across all nvrtcCompileProgram invocations and collect all the flame graphs into a single report, giving a consolidated view of the entire JIT compilation process.
This capability is particularly useful in complex applications where multiple kernels are compiled at runtime, enabling you to gather detailed performance insights for each kernel without having to manage multiple trace files manually.
Use cases
Now that we’ve described this new feature that helps to profile your compilation flow, we’ll show some use cases where it can be helpful:
- Visualizing the end-to-end workflow of compilation
- Identifying template instantiation bottlenecks
- Identifying expensive header files
- Identifying anomalous bottlenecks
Visualizing the end-to-end workflow of compilation
The --fdevice-time-trace feature enables you to visualize the end-to-end workflow of the compilation process, providing a comprehensive timeline of all major stages:
- Preprocessing
- Host and device code compilation
- Device linking
- Binary generation
This holistic view is particularly valuable for understanding how different phases interact and contribute to the total compile time. By examining this visualization, you can identify stages that dominate the workflow, determine whether delays stem from specific code constructs or the compiler pipeline itself, and prioritize areas for optimization.
The visualizer also displays multithreading modes of the compiler, such as --threads or --split-compile. Figures 2 and 3 shows the difference in the visualization with and without --threads.
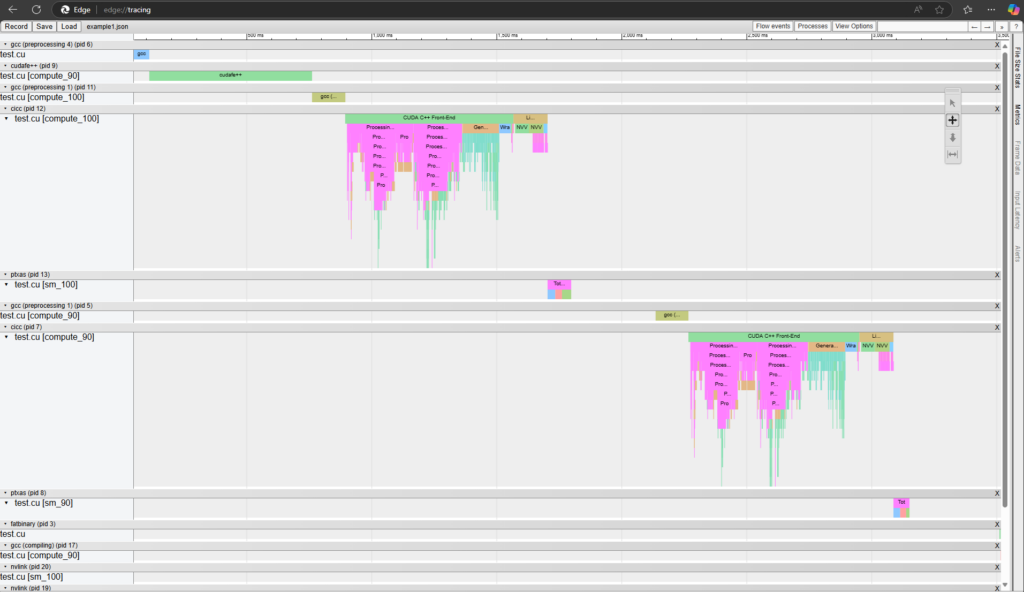
nvcc compilation flow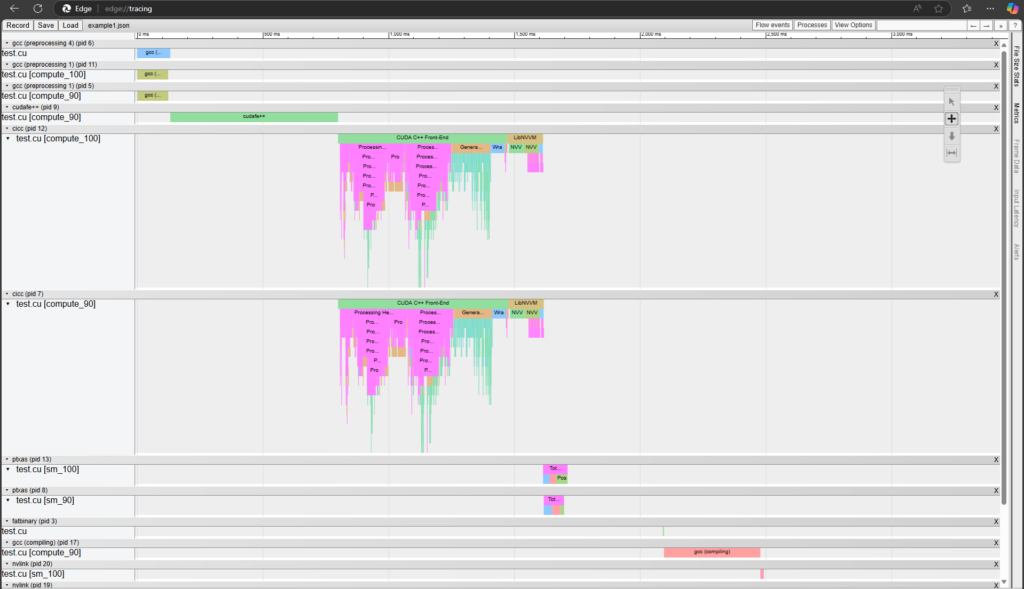
--threads enabledIdentifying template instantiation bottlenecks
Template metaprogramming is a powerful practice that enables you to write flexible and reusable code. Popular CUDA projects such as Thrust and Cutlass often use templates to enable compile-time flexibility, enabling these libraries to adapt to various data types, execution policies, and hardware capabilities.
While this flexibility benefits you by making it easier to write high-performance GPU code, it can also come with a cost. Complex templates, especially those with recursive or deeply nested instantiations, can significantly increase compile times.
Complex templates lead to increased compile times because the compiler must instantiate each template with specific types and parameters, a process that can cascade into multiple nested instantiations for deeply recursive or layered templates. Each instantiation requires additional compiler resources, as it evaluates and generates code for every possible variation, ultimately consuming significant time and memory, especially in heavily templated code.
Figure 4 shows the profile of a program with a deep template recursion tree. The visualization makes it easy to identify the recursive tree and provides enough information for you to identify the problematic code in source. You can then refactor your code to minimize template complexity, using techniques such as using extern templates to avoid redundant instantiations, replacing deep recursive templates with iterative approaches, explicit instantiation of frequently used templates, and so on.
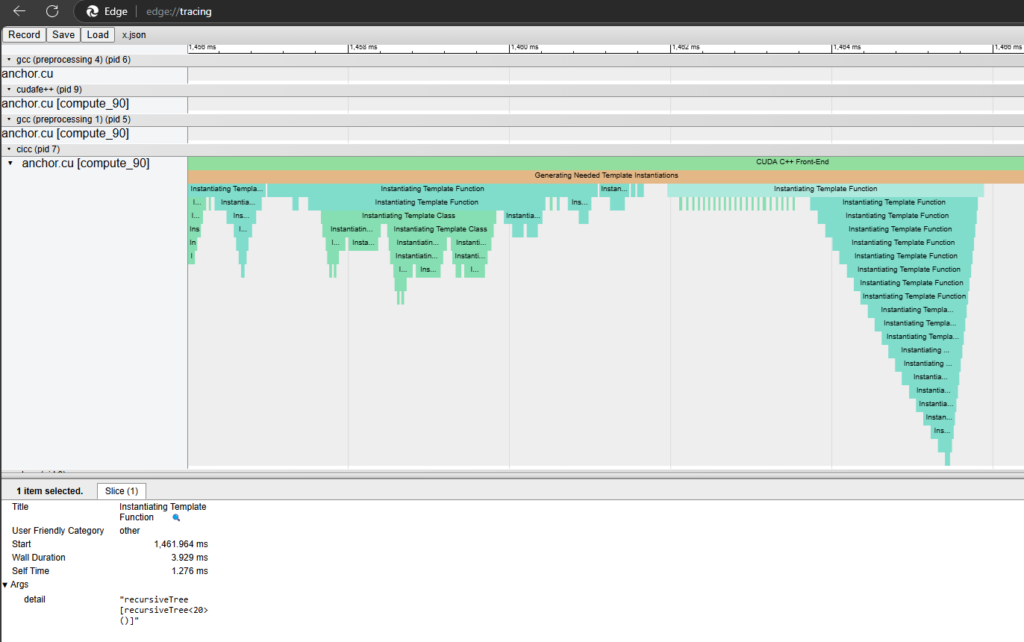
--fdevice-time-trace to identify a deep template treeIdentifying expensive header files
Headers that significantly impact compile times often contain complex templates or macros that are included across multiple translation units. These headers can lead to repeated work for the compiler, as it processes the same definitions and instantiations for each inclusion.
With the --fdevice-time-trace feature, you can identify headers that require substantial processing time by analyzing the timeline of header file events. This insight enables you to optimize your build process by using techniques such as precompiled headers, reducing unnecessary inclusions, or modularizing large headers to minimize redundant compilation effort and improve overall performance.
Identifying anomalous bottlenecks
Beyond external factors like templates and headers, bottlenecks can also arise from within the compiler itself during specific phases of the compilation process.
For instance, the NVVM Optimizer, code generator, device linker, or backend PTX optimization of a compilation unit may unexpectedly consume a large amount of time. These internal anomalies are often hard to detect without detailed insights into the compiler’s workflow.
The --fdevice-time-trace feature provides a timeline that breaks down the compiler’s execution into granular stages, highlighting the areas where the most time is spent. If a particular phase, such as the NVVM Optimizer or PTX generation, stands out as unusually time-intensive, it signals an opportunity to investigate further.
This level of transparency helps you identify whether the bottleneck is due to the structure of your code or specific behaviors within the compiler, enabling more informed optimization strategies. It can also enable you to identify and file bugs for anomalous behavior with the compiler team.
Figure 5 shows a real-world example of a case where compile time was excessively bottlenecked on optimizing one kernel in PTXAS. It shows that PTXAS took an inordinate amount of time while attempting to optimize "_Z9NopKernelPi". This report helps you understand the underlying issue and provides you with the necessary insight to file a detailed bug report, if needed, with the engineering teams.
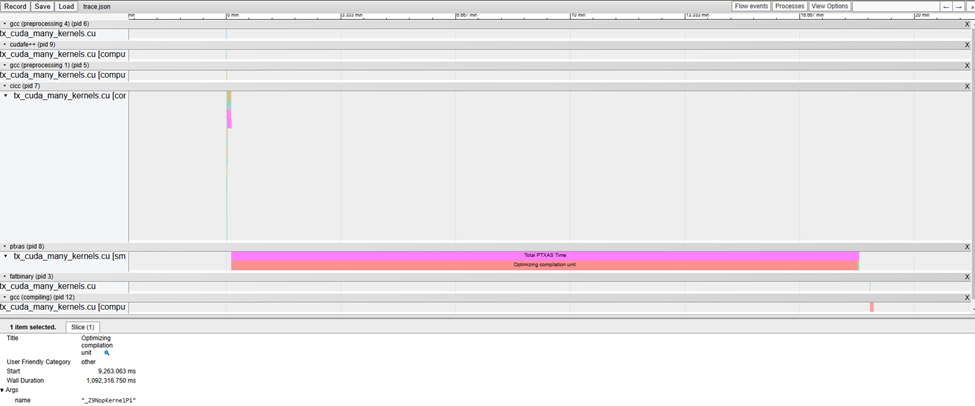
--fdevice-time-trace to identify anomalous bottlenecksConclusion
The --fdevice-time-trace feature represents a significant step forward in improving developer productivity and enabling optimization of compilation workflows in CUDA C++. By providing detailed insights into template instantiation, header processing, internal compiler phases, and the overall compilation workflow, it empowers you to identify and address bottlenecks with precision, and can be an integral part of your development process.
We encourage you to try out --fdevice-time-trace in your projects, explore its potential, and share your feedback with the community. Your input is vital to refining this feature and ensuring it meets the needs of CUDA developers around the world. Let’s work together to make CUDA development even faster and more efficient!
Related resources
- DLI course: Accelerating CUDA C++ Applications with Concurrent Streams
- DLI course: Accelerating CUDA C++ Applications with Multiple GPUs
- DLI course: An Even Easier Introduction to CUDA
- GTC session: Build CUDA Software at the Speed of Light
- GTC session: The CUDA C++ Developer’s Toolbox
- GTC session: CUDA Techniques to Maximize Compute and Instruction Throughput
- https://developer.nvidia.com/blog/optimizing-compile-times-for-cuda-c/