


High borrowing costs and exchange rate volatility continue to deter long-term infrastructure investment, especially in the least developed countries.
And multinationals are restructuring supply chains towards South-East Asia, Eastern Europe and Central America – a shift that began during the pandemic and is accelerating.
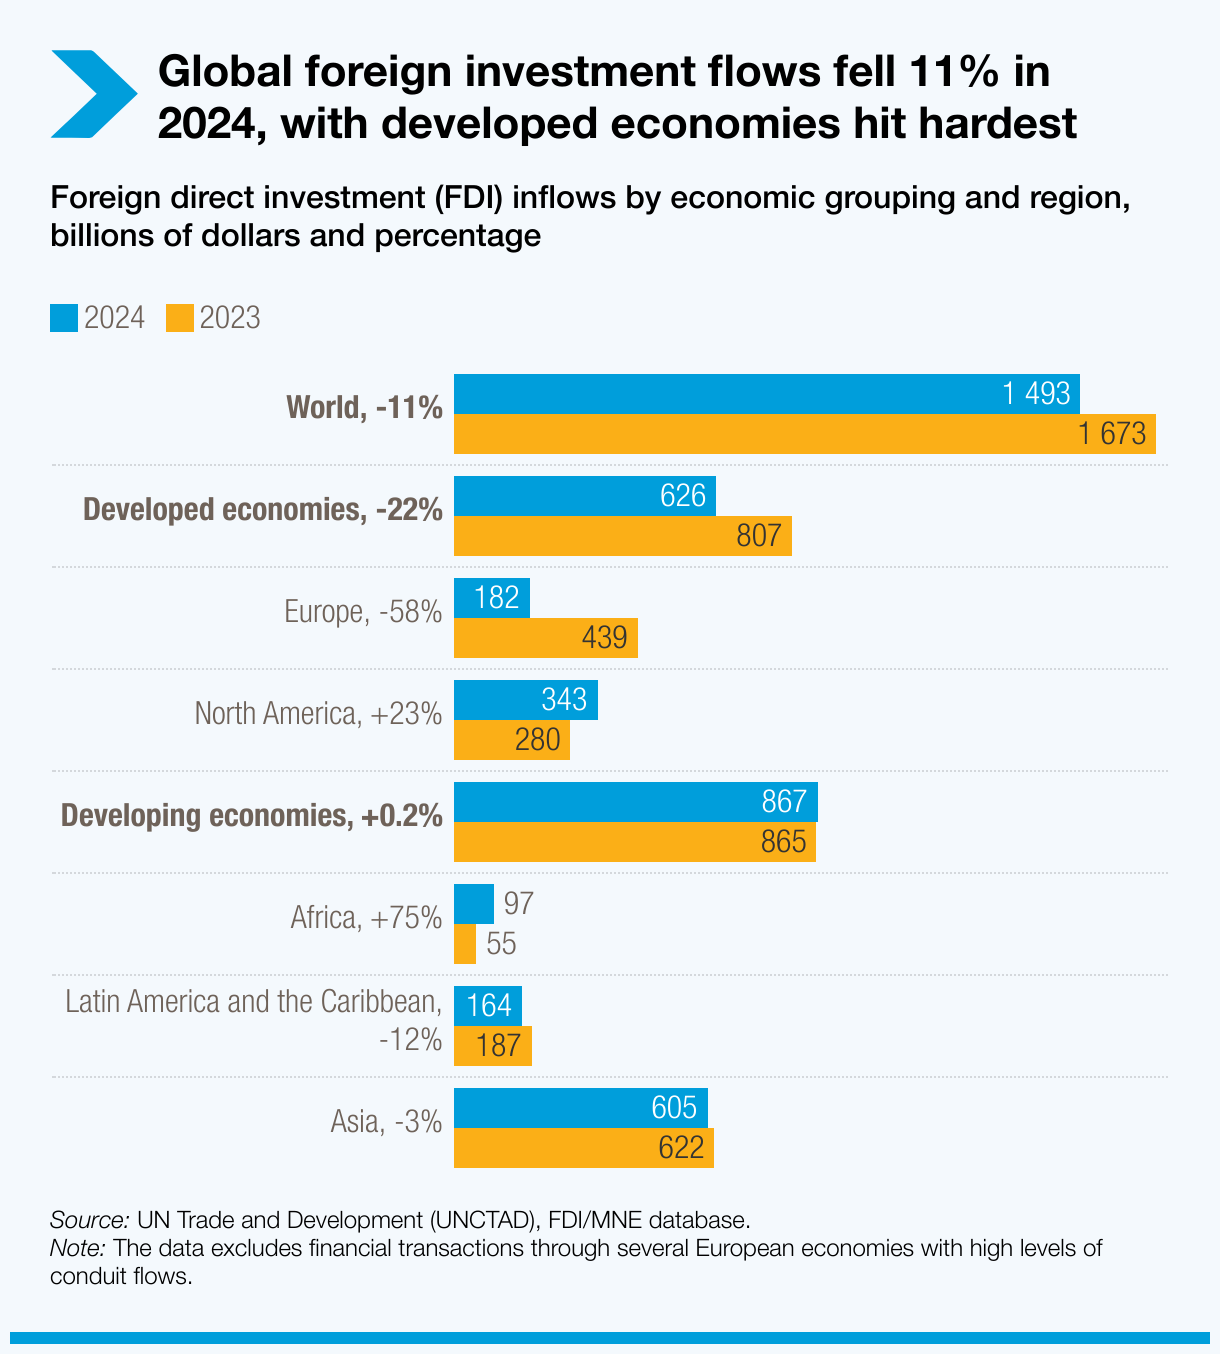
Regional trends reveal sharp divides.
FDI to developed economies fell by 22%.
Europe was hit hardest, with inflows down 58% in 2024. FDI fell in more than half of EU countries, with sharp declines in Germany (-89%), Spain (-39%), Italy (-24%) and France (-20%).
North America saw a 23% rise, driven by a wave of semiconductor megaprojects in the United States, where FDI rose 20%.
Global foreign investment flows fell 11% in 2024, with developed economies hit hardest
Foreign direct investment (FDI) inflows by economic grouping and region, billions of dollars and percentage
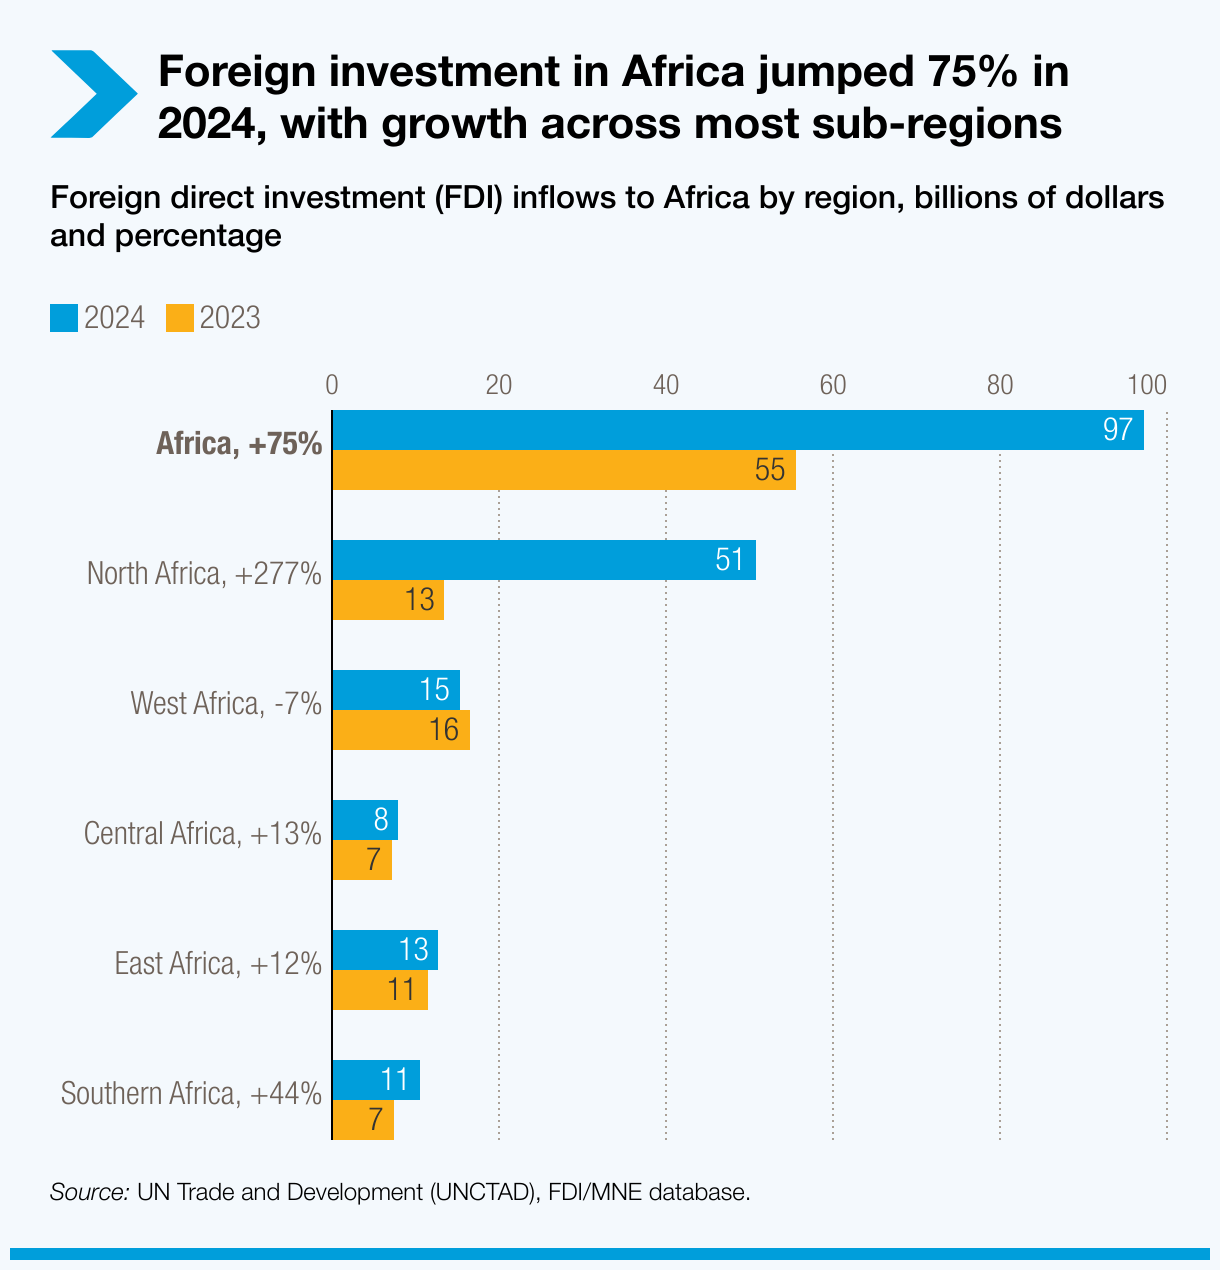
Africa saw a record 75% rise in FDI, driven by a mega infrastructure project in Egypt. Excluding that, flows still grew 12%, supported by investment reforms and improved facilitation across the continent.
Foreign investment in Africa jumped 77% in 2024, with growth across most sub-regions
Foreign direct investment (FDI) inflows to Africa by region, billions of dollars and percentage
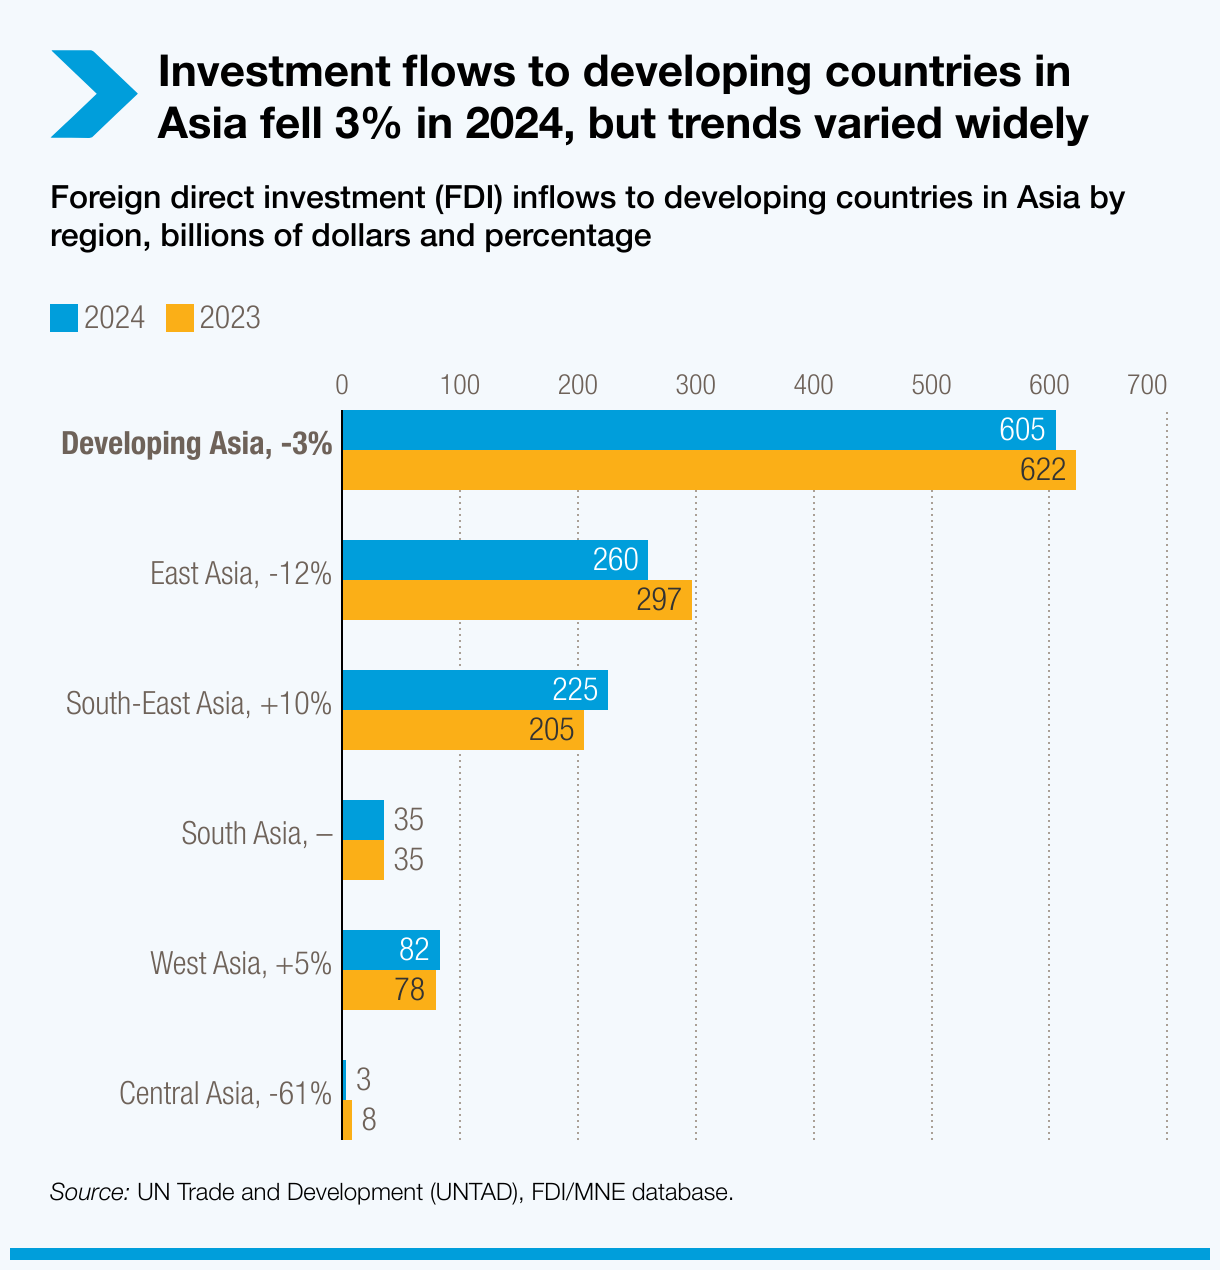
Asia remained the top recipient region, despite a 3% overall decline and a 29% drop in flows to China. South-East Asia stood out, with ASEAN countries up 10%, reaching a record $225 billion in FDI. India saw strong momentum in greenfield investment, even as total inflows dipped slightly.
Investment flows to developing countries in Asia fell 3% in 2024, but trends varied widely
Foreign direct investment (FDI) inflows to developing countries in Asia by region, billions of dollars and percentage
The Middle East continued to see strong inflows, especially in the Gulf, thanks to diversification efforts and investment in non-oil sectors.
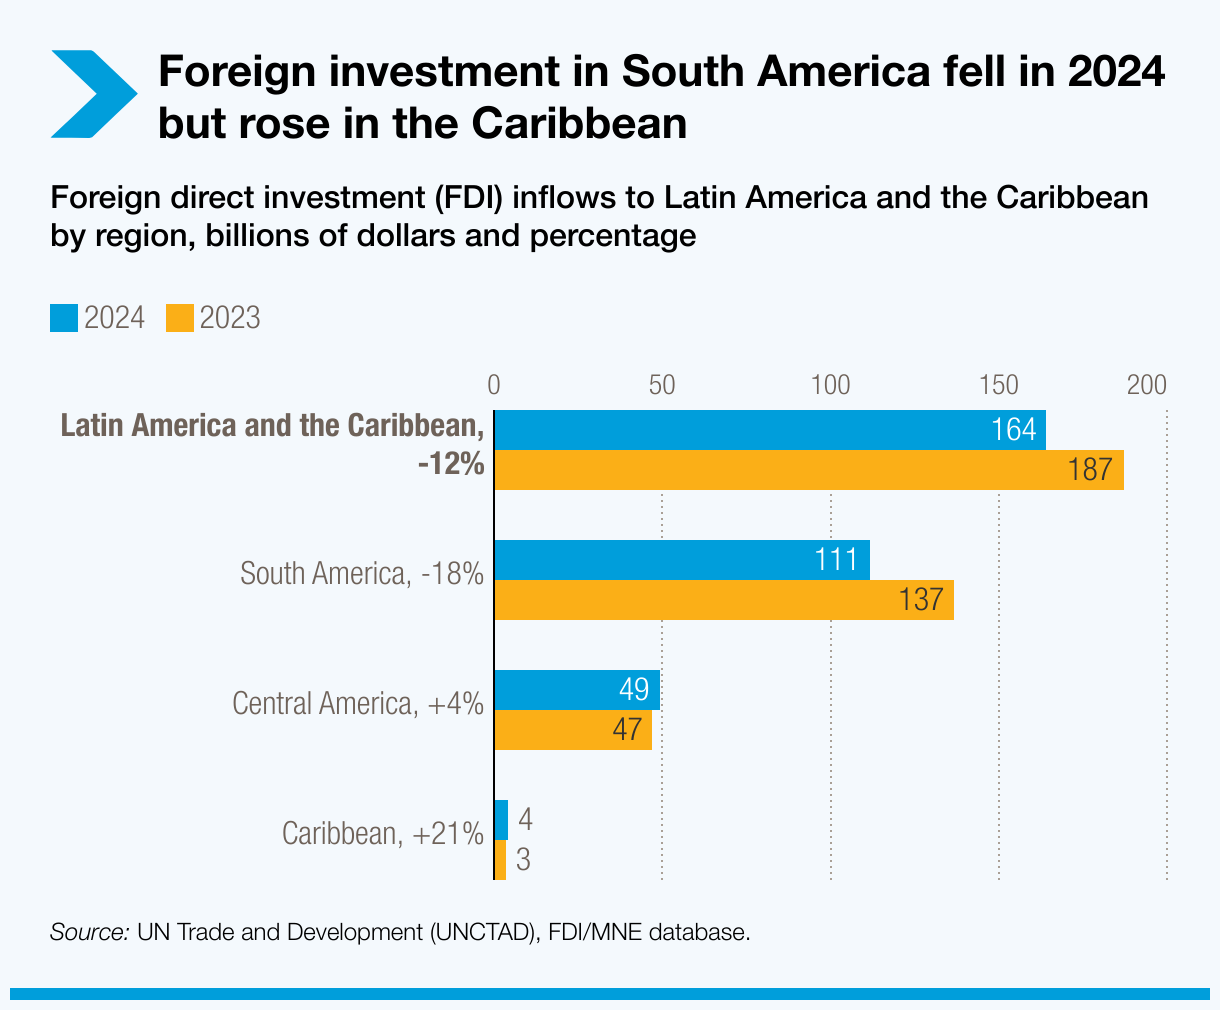
Latin America and the Caribbean saw a 12% drop in FDI. But new greenfield projects in Argentina, Brazil and Mexico signalled renewed investor interest and growing momentum in productive sectors.
Foreign investment in South America fell in 2024 but rose in the Caribbean
Foreign direct investment (FDI) inflows to Latin America and the Caribbean by region, billions of dollars and percentage
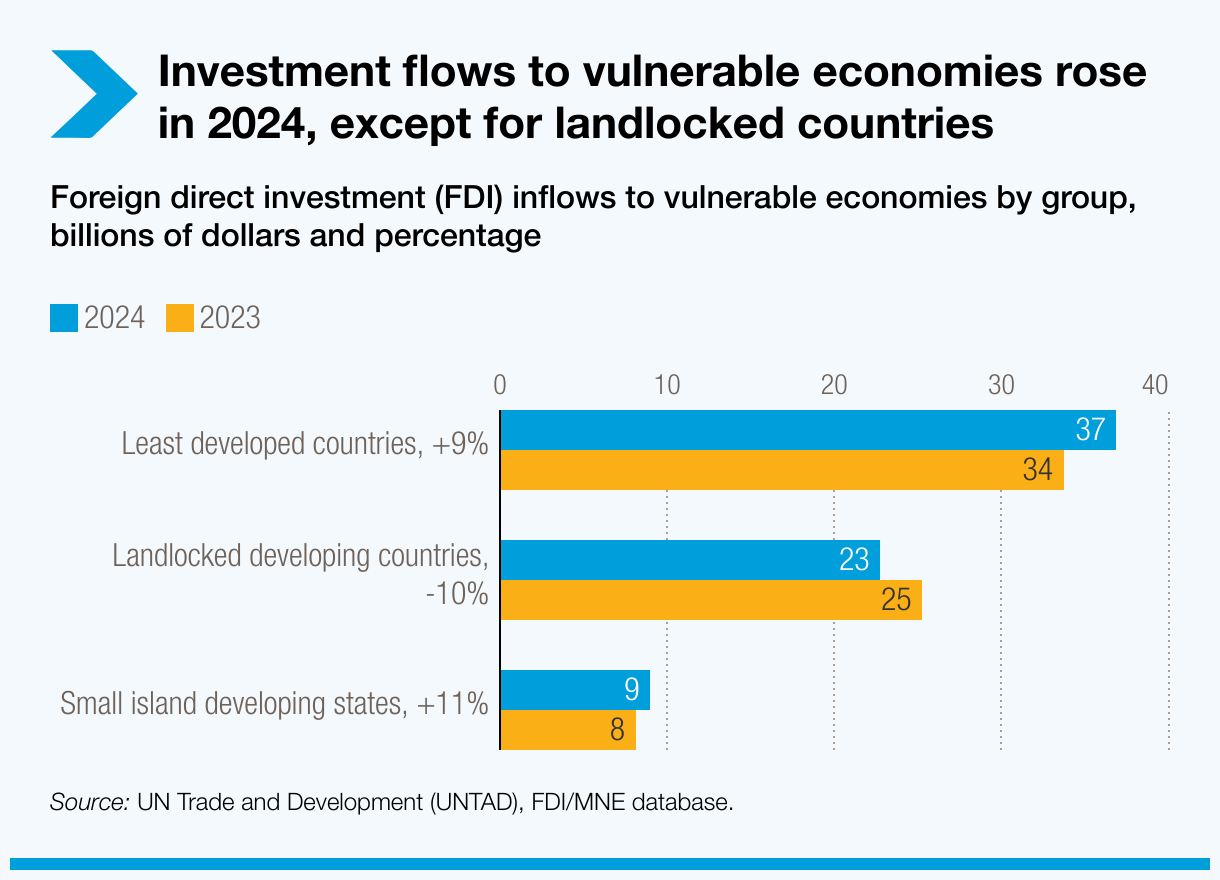
Vulnerable economies saw modest gains. FDI to least developed countries rose 9% to $37 billion – just 2% of global flows. Landlocked developing countries saw a 10% drop, while small island developing states posted 14% growth. In all three groups, FDI remains concentrated among a few countries.
Investment flows to vulnerable economies rose in 2024, except for landlocked countries
Foreign direct investment (FDI) inflows to vulnerable economies by group, billions of dollars and percentage
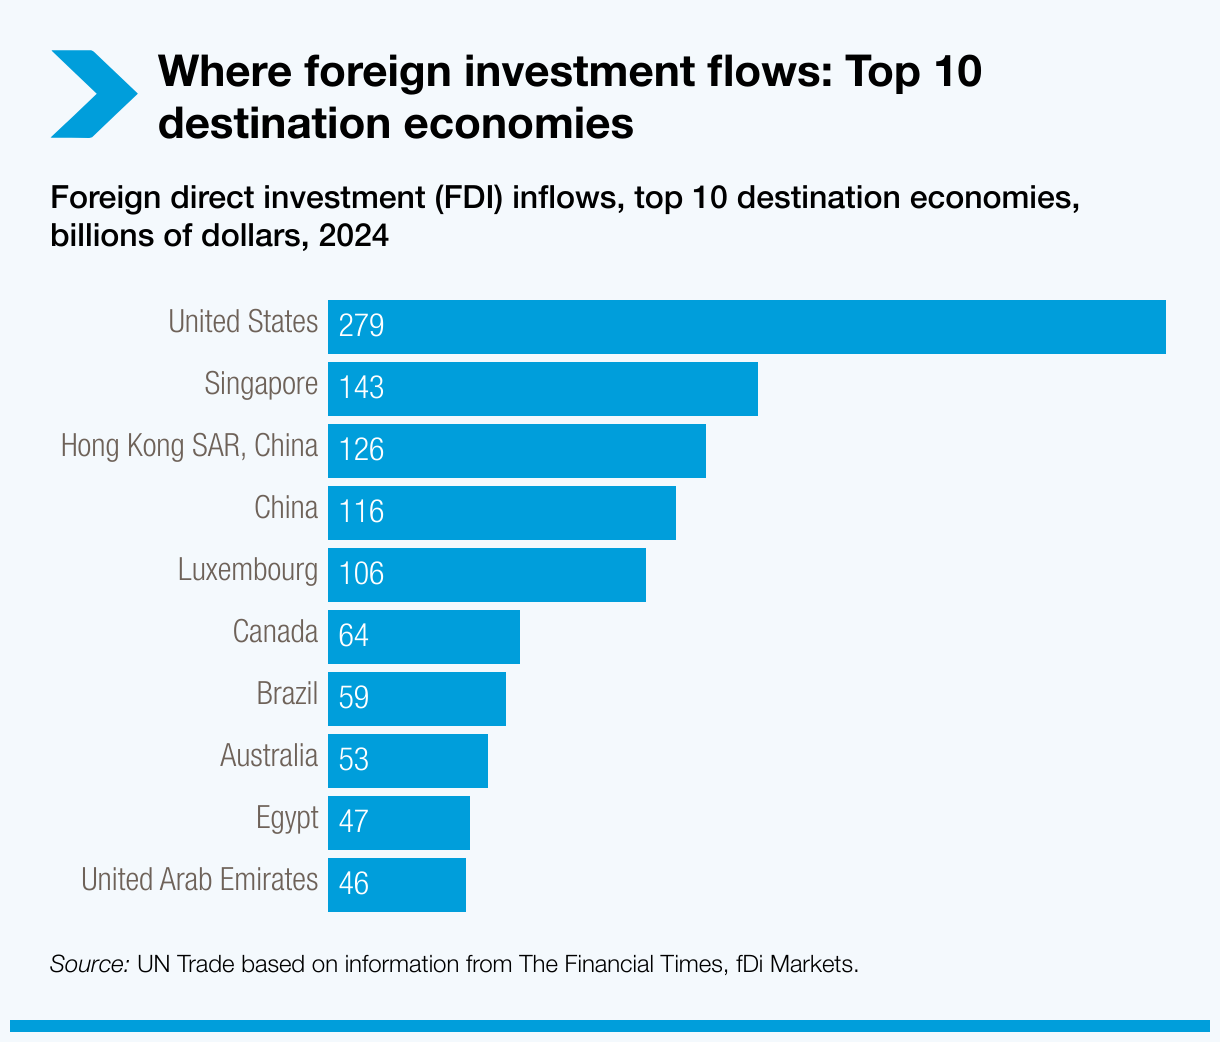
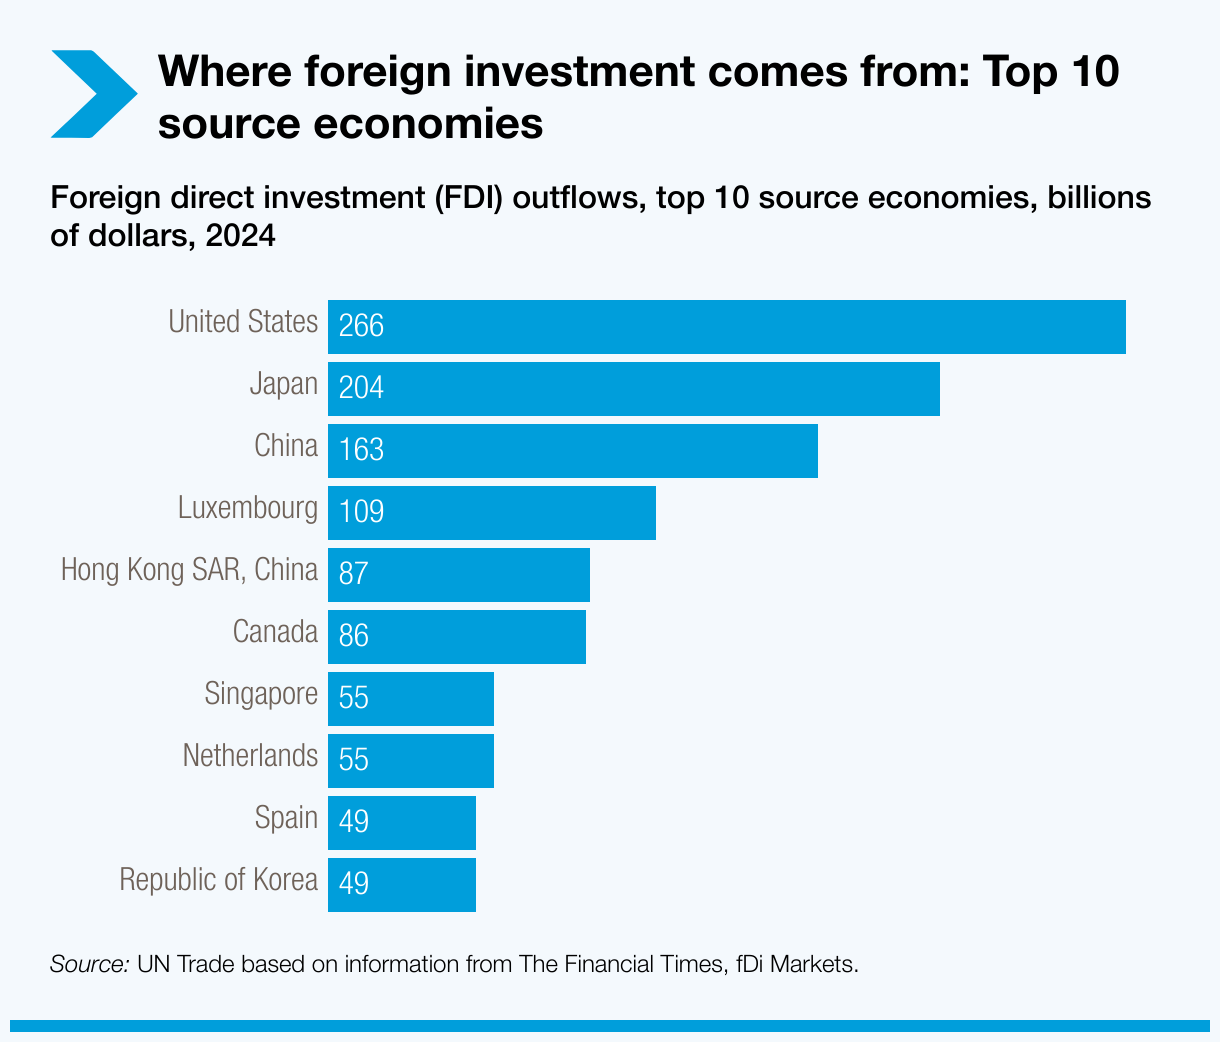
Top 10 source and destination economies for FDI.
The US remains both the top source and destination for foreign direct investment (FDI). Notably, five Asian economies rank among the top 10 sources of FDI outflows, underscoring the region’s key role as a global investor.
Where foreign investment flows: Top 10 destination economies
Foreign direct investment (FDI) inflows, top 10 destination economies, billions of dollars, 2024
Where foreign investment comes from: Top 10 source economies
Foreign direct investment (FDI) outflows, top 10 source economies, billions of dollars, 2024
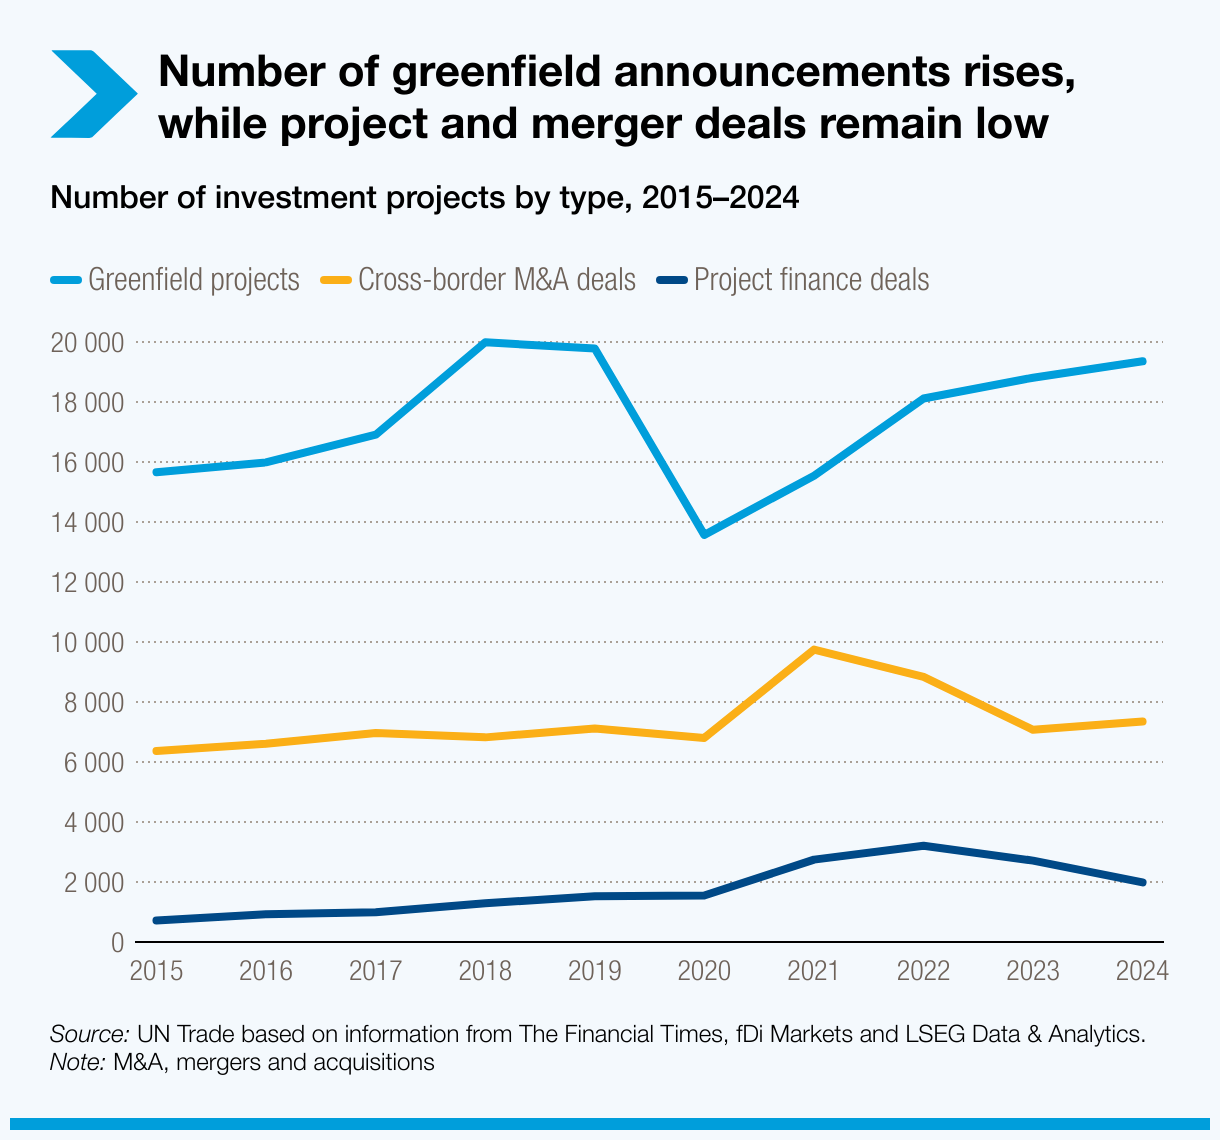
Investment trends diverge across sectors and industries.
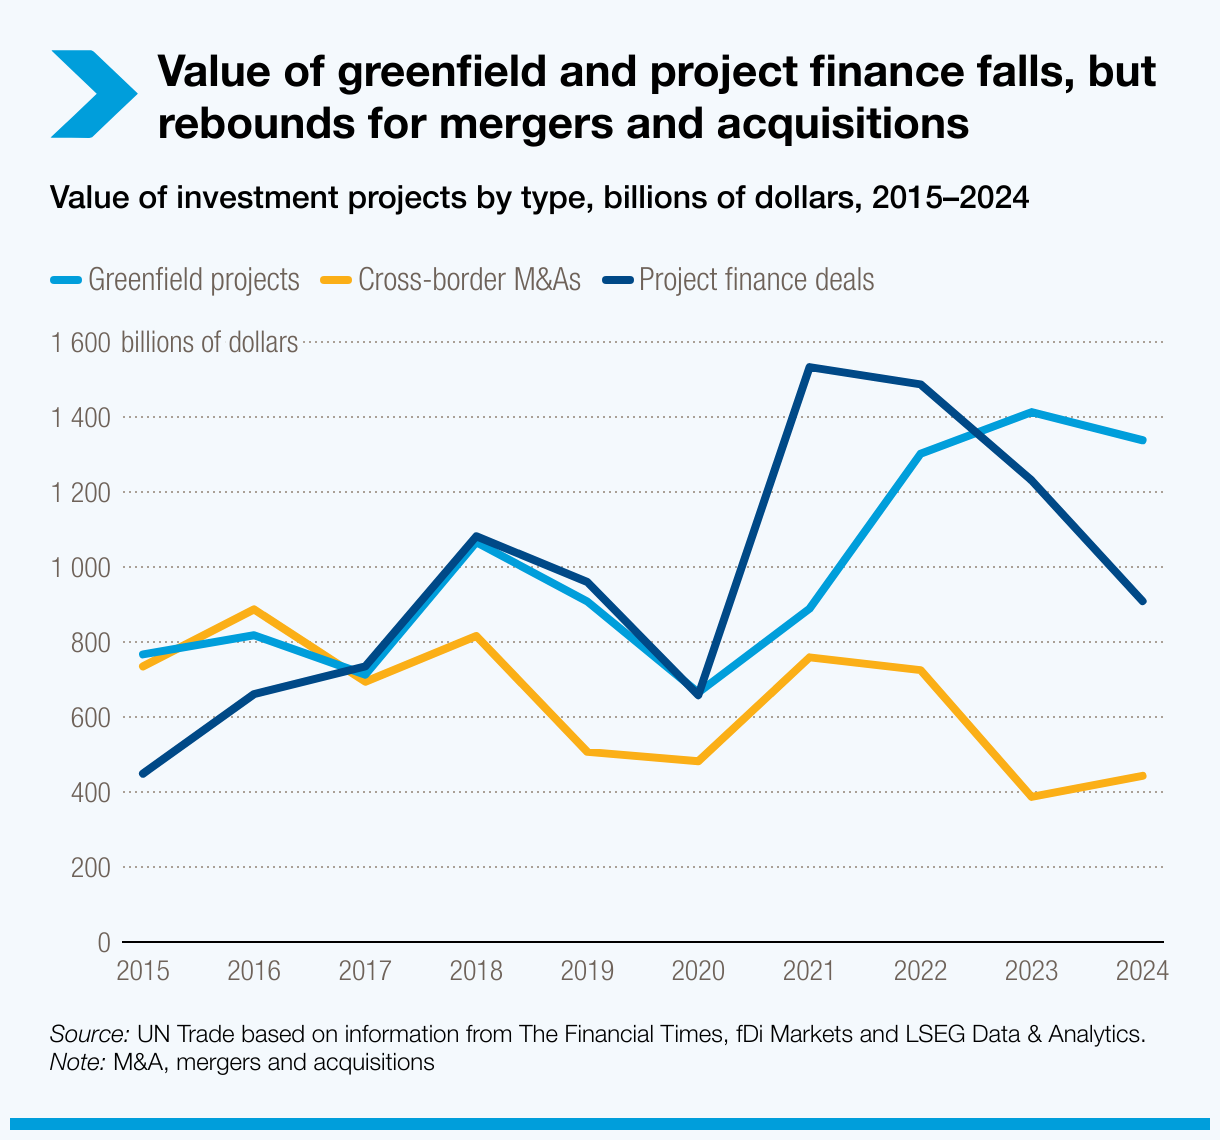
Greenfield investments – where companies build new facilities abroad – rose in number but fell 5% in value. Still, total announced investment remained historically high at $1.3 trillion.
Cross-border mergers and acquisitions (M&As) rose 14% to $443 billion but remain below the average of the last decade. Deals are increasingly shifting to regional markets amid tighter regulations and geopolitical tensions.
International project finance – a key source of funding for infrastructure – dropped 26%, continuing a multi-year slump. Least developed countries were hit hardest.
Number of greenfield announcements rises, while project and merger deals remain low
Number of investment projects by type, 2015–2024
Value of greenfield and project finance falls, but rebounds for mergers and acquisitions
Value of investment projects by type, billions of dollars, 2015–2024
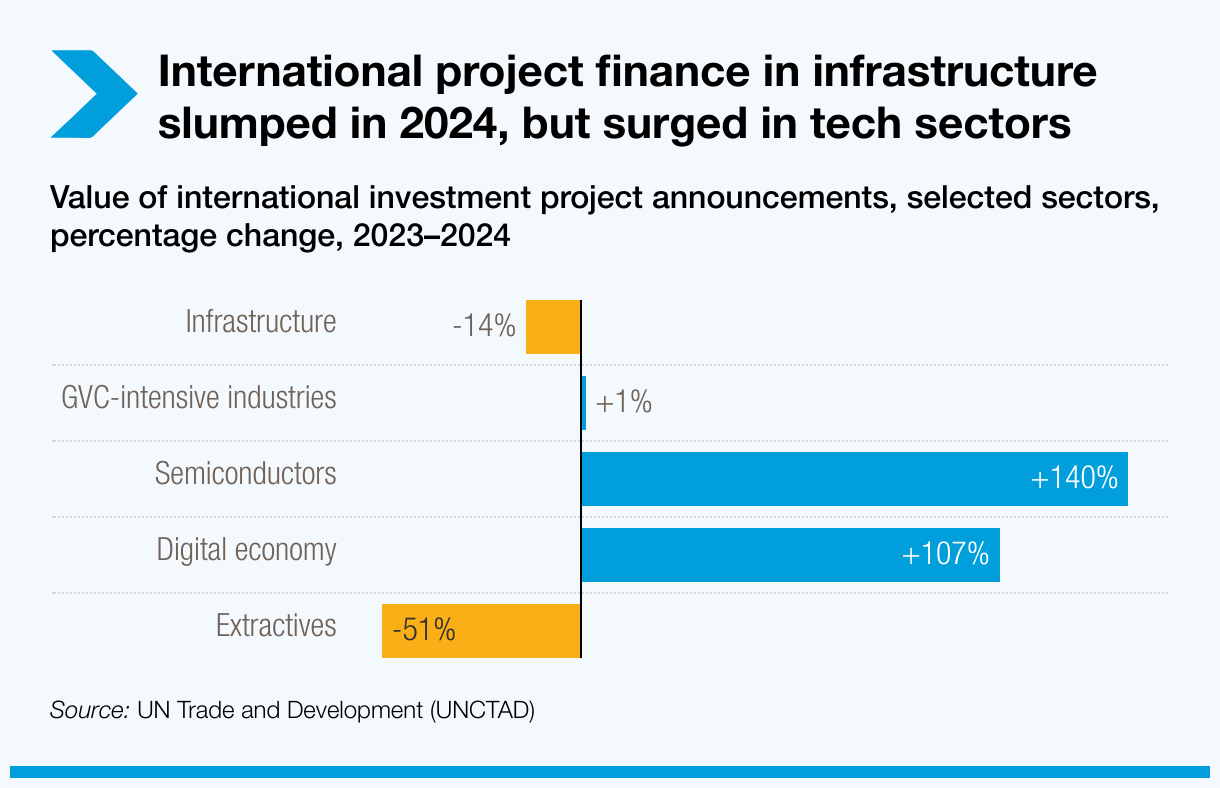
International project finance in infrastructure slumped in 2024, but surged in tech sectors
Value of international investment project announcements, selected sectors, percentage change, 2023–2024
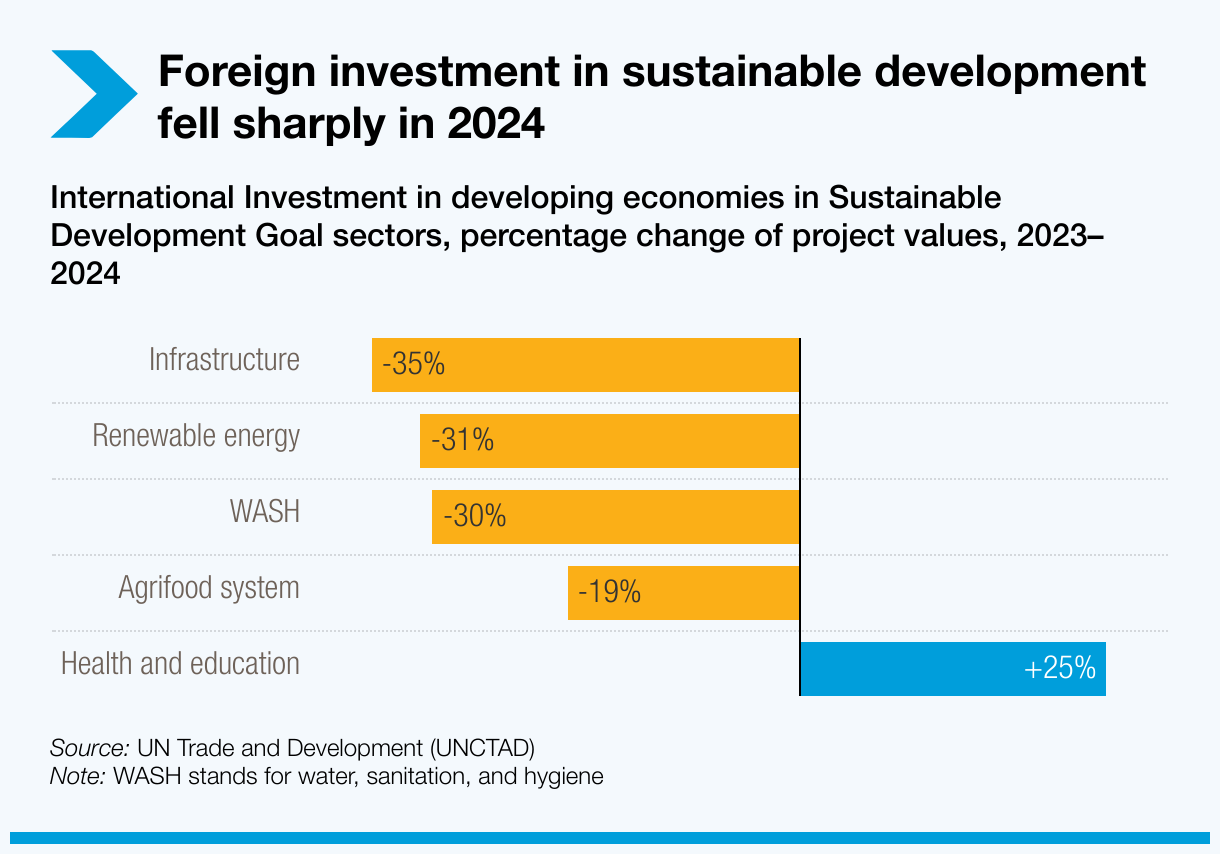
Sectors critical to the Sustainable Development Goals suffered. Investment flows to developing countries for infrastructure fell 35%, renewable energy 31%, water and sanitation 30% and agrifood systems 19%. Only the health sector saw growth. Projects rose by about one fifth in number and value, but total volumes remained small – under $15 billion.
Foreign investment in sustainable development fell sharply in 2024
International Investment in developing economies in Sustainable Development Goal sectors, percentage change of project values, 2023–2024