


Large ensembles are essential for predicting rare, high-impact events that cannot be fully understood through historical data alone. By simulating thousands of potential scenarios, they provide the statistical depth necessary to assess risks, prepare for extremes, and build resilience against once-in-a-century disasters.
Global insurance group AXA is conducting simulations with cutting-edge AI weather models and tools using the NVIDIA Earth-2 platform to improve its hurricane risk assessment research by recreating hurricanes like Milton and generating thousands of years of hypothetical hurricane scenarios. This approach fills critical gaps in data to enhance the understanding of the statistical likelihood of extreme events and transform how the insurance industry addresses disaster risk.
Understanding low-likelihood, high-impact hurricane events
The 2024 hurricane season, marked by events like Hurricane Milton and Helene, underscored the devastating impact of extreme weather events on society. For the financial and insurance (FSI) industry, these rare yet catastrophic events are among the costliest to insure, especially in the North Atlantic, where tropical cyclones account for significant damage. However, accurately assessing the likelihood of such events presents a unique challenge. Historic weather records do not contain enough of rare, impactful extreme events to enable statistically robust risk assessment.
Traditional statistical methods for risk assessment attempt to address the lack of data by statistically inflating datasets. However, physical plausibility remains a key limitation of these methods. They cannot capture complex event correlations, such as the probability of sequential hurricane occurrences or intensity interdependencies. Furthermore, they generate variations of historical events rather than entirely new scenarios. On the contrary, numerical simulations based on physical models, while accurate and physically plausible, are prohibitively expensive for generating the thousands of years of synthetic data needed to build robust statistics on these rare events.
AI-based weather modeling has the potential to offer a transformative alternative, enabling simulations that run orders of magnitudes faster than physics-based methods while matching, or even outperforming their accuracy. A one-year simulation of the Spherical Fourier Neural Operator (SFNO) takes only 12.8 minutes on a single modern GPU, whereas a comparable simulation using the Integrated Forecast System (IFS) requires one hour on 1,000 dual-socket CPU nodes, according to The ECMWF Scalability Programme: Progress and Plans.
AXA used ad hoc models to generate large ensembles of counterfactual hurricane data through AI, exploring what could have happened in the past and what might happen in the future. This includes not only individual storm scenarios but also entire synthetic hurricane seasons, providing a rich dataset for risk assessment. The ability of AI to capture the chaotic nature of weather makes it an invaluable tool for industries grappling with uncertainty.
This post delves into the problem of hurricane risk assessment, and how AXA generates hypothetical hurricane seasons. This work highlights how AI has the potential to empower AXA to better quantify and manage the risks posed by rare extreme events.
Simulating hurricane scenarios
Earth-2 provides tools and reference pipelines for advanced AI models like HENS to generate massive hurricane ensembles. Originally developed at UC Berkeley for heat wave prediction, HENS is optimized for capturing weather extremes and quantifying their associated probabilities and uncertainties. For more information, see Huge Ensembles Part I: Design of Ensemble Weather Forecasts using Spherical Fourier Neural Operators.
Customized FCN-SFNO architecture architecture and training recipes have been refined to better capture extreme weather events.
- Multiple checkpoints for model uncertainty: To account for uncertainty in forecast models, traditional numerical ensemble systems perturb the parameters associated to modelling, to model effects that cannot be resolved by the underlying forecast model. HENS-SFNO replicates this approach by employing multiple, individually trained model checkpoints.
- Bred vector perturbation for initial conditions: To address uncertainties in the initial states of hurricane simulations, a bred vector perturbation method was tailored to produce calibrated ensembles in combination with the available set of checkpoints.
Experiment 1: Exploring alternative outcomes of historic hurricanes
This experiment is focused on simulating individual historic hurricanes and exploring alternative outcomes. In addition to answering what could have happened, such data can help assess the quality of generated hurricane tracks and investigate biases in the intensity of the generated hurricanes. To produce and analyze large ensembles of historic hurricanes for accurate risk assessment, the following steps have been implemented using Earth2Studio Python library from the Earth-2 platform:
Step 1: Setup
Choose a set of hurricanes that occurred outside the training period, ensuring diversity and relevance in the simulations.
Step 2: Initialize HENS
- Before cyclogenesis: Begin the ensemble generation two days before cyclogenesis (hurricane formation). This gives enough time to simulate the atmospheric conditions leading up to the event.
- Day of cyclogenesis: Initiate the simulation on the exact day the hurricane forms.
- After cyclogenesis: Initiate the simulation two days after the cyclogenesis to refine the predictions.
- Before landfall
- Two days prior to landfall: Extend the simulation to capture the dynamics and movement of the hurricane two days before landfall, ensuring enough temporal coverage for accurate predictions.
- One day before landfall: Perform another set of simulations one day before landfall to refine the predictions and capture fine-grained details.
Step 3: Roll out simulation
Simulate for approximately 15 days: Run the hurricane ensemble for approximately 15 days after landfall or until the hurricane dissipates, capturing its full lifecycle.
Step 4: Analyze tracks
- Track the Hurricane’s Path: Collect the hurricane tracks and compare them with historical data to validate accuracy and evaluate model performance.
- Compare Trackers: Evaluate how different tracking models capture the hurricane’s movement and how the AI-generated tracks match observed data.
Step 5: Analyze intensity
- Evaluate intensity patterns: Assess the intensity of the simulated hurricanes, noting whether any underestimation or overestimation occurs during the hurricane lifecycle.
- Systematic bias: Investigate whether the model underestimates hurricane intensity—a known issue in many numerical weather models—and explore methods to correct it.
Step 6: Custom analyses
Gather additional metrics for analysis, such as geographical impacts, storm surge, or specific regional effects, ensuring the ensemble simulations meet their specific needs for risk assessment.
Experiment 1 results: Hurricane Milton revisited by AXA analysis workflow
Hurricane Milton exhibited atypical characteristics, developing in the southwestern Gulf of Mexico during October and following an anomalous trajectory toward Florida, deviating from conventional tropical cyclone climatology for that basin and season.
Figure 1 shows Hurricane Milton simulations using Hens-SFNO with multiple initialization dates around cyclogenesis. The model reproduces the storm track, though with somewhat underestimated surface wind intensities. The various model checkpoints enable analysis of alternative trajectory scenarios that could have impacted different regions of Florida and the southern US coast.
The ability of HENS-SFNO to model counterfactual hurricane scenarios makes it a valuable tool for risk prevention as it enables emergency managers to evaluate potential impact scenarios and develop more comprehensive mitigation strategies.

Experiment 2: Exploring alternative outcomes to hurricane seasons
This experiment looks at a broader perspective. Instead of focusing on individual storms, the goal is to simulate full hurricane seasons to generate statistical insights about hurricane frequency, intensity, and interrelationships of individual events within a season. This approach maps out possible future seasonal scenarios through the creation of entirely new plausible events.
- Step 1: Split up the hurricane season into chunks of six-week rollouts to mitigate potential model bias.
- Step 2: Initialize HENS using two-week intervals over the hurricane season, incorporating initial conditions (ICs) from various years to ensure diverse outcomes.
- Step 3: Run a seven-day warm-up period at the beginning of each simulation to allow a partial decorrelate from the initial conditions.
- Step 4: Record hurricanes that have cyclogenesis in the following four weeks.
- Step 5: Track density analysis grouped by hurricane category, to assess the distribution and frequency of hurricanes throughout the season across different intensity levels.
Experiment 2 results: Exploring counterfactual tropical cyclone climatology
The HENS-SFNO model can simulate a wide range of unobserved trajectories over a season based on perturbed simulations. The ensemble of simulated trajectories exhibits a strong correspondence with the climatological framework (using ground truth IBTrACS data) while extending its variability range, thereby encompassing the observed tracks.
However, the model requires a bias correction and spatial downscaling on near-surface wind speeds, to enhance its suitability for risk assessment studies. A major and strong advantage of this methodology lies in its ability to rapidly generate catalogs of thousands of climatic events, which is critically important for climate risk modeling in a constantly and rapidly evolving climate.

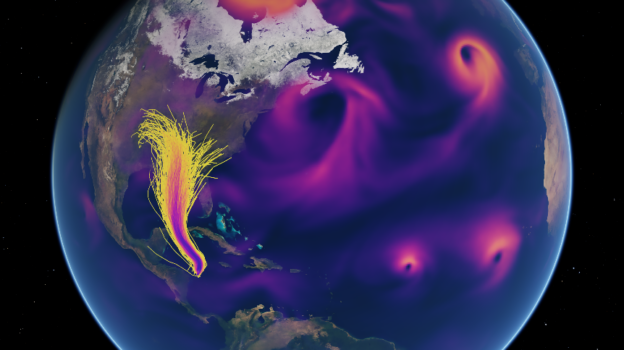
Demo: Hurricane Helene
Video 1 shows the result of a 1,024-member ensemble of Hurricane Helene, which made landfall in the US in September 2024. It shows four of the 1,024 samples drawing the track one after another, then all the tracks of the full ensemble are drawn at the same time. The ensemble was initialized on September 23, 2024, 39 hours before it was categorized as a tropical storm. The results show the range of possible outcomes at that time. The data has been produced with the HENS pipeline in Earth2 Studio, while the visualization was done in NVIDIA Omniverse.
Spotlight: AXA Explores AI-Driven Hurricane Risk Assessment with NVIDIA Earth-2