


Countries by Share of the Global Economy
As 2022 comes to a close we can recap many historic milestones of the year, like the Earth’s population hitting 8 billion and the global economy surpassing $100 trillion.
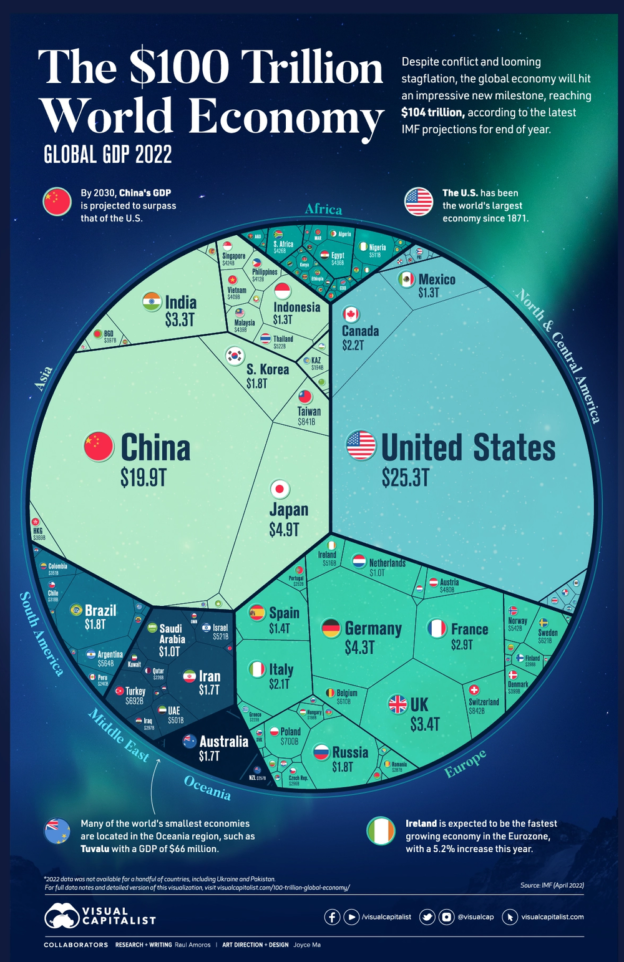
In this chart, we visualize the world’s GDP using data from the IMF, showcasing the biggest economies and the share of global economic activity that they make up.
The GDP Heavyweights
The global economy can be thought of as a pie, with the size of each slice representing the share of global GDP contributed by each country. Currently, the largest slices of the pie are held by the United States, China, Japan, Germany, and India, which together account for more than half of global GDP.
Here’s a look at every country’s share of the world’s $101.6 trillion economy:
| Rank | Country | GDP (Billions, USD) |
|---|---|---|
| #1 | 🇺🇸 United States | $25,035.2 |
| #2 | 🇨🇳 China | $18,321.2 |
| #3 | 🇯🇵 Japan | $4,300.6 |
| #4 | 🇩🇪 Germany | $4,031.1 |
| #5 | 🇮🇳 India | $3,468.6 |
| #6 | 🇬🇧 United Kingdom | $3,198.5 |
| #7 | 🇫🇷 France | $2,778.1 |
| #8 | 🇨🇦 Canada | $2,200.4 |
| #9 | 🇷🇺 Russia | $2,133.1 |
| #10 | 🇮🇹 Italy | $1,997.0 |
| Total World GDP | $101,559.3 |
Just five countries make up more than half of the world’s entire GDP in 2022: the U.S., China, Japan, India, and Germany. Interestingly, India replaced the UK this year as a top five economy.
Adding on another five countries (the top 10) makes up 66% of the global economy, and the top 25 countries comprise 84% of global GDP.
The World’s Smallest Economies
The rest of the world — the remaining 167 nations — make up 16% of global GDP. Many of the smallest economies are islands located in Oceania.
Here’s a look at the 20 smallest economies in the world:
Tuvalu has the smallest GDP of any country at just $64 million. Tuvalu is one of a dozen nations with a GDP of less than one billion dollars.
The Global Economy in 2023
Heading into 2023, there is much economic uncertainty. Many experts are anticipating a brief recession, although opinions differ on the definition of “brief”.
Some experts believe that China will buck the trend of economic downturn. If this prediction comes true, the country could own an even larger slice of the global GDP pie in the near future.
See what hundreds of experts are predicting for 2023 with our Global Forecast Series.


MARKETS
Ranked: The 100 Biggest Public Companies in the World
Who made it to the top? Here are the world’s most valuable public companies in 2022 as the year comes to an end.
The Biggest Companies in the World in 2022
View the high-resolution of the infographic by clicking here.
This year has been shaped by uncomfortable macroeconomic headwinds.
Trillions of dollars were erased in public company market capitalizations, investor confidence waned, and cost pressures squeezed consumer pocketbooks.
Taken together, many of the world’s largest companies experienced sharp declines in market share. Still, a few companies in key sectors had positive growth over the year.
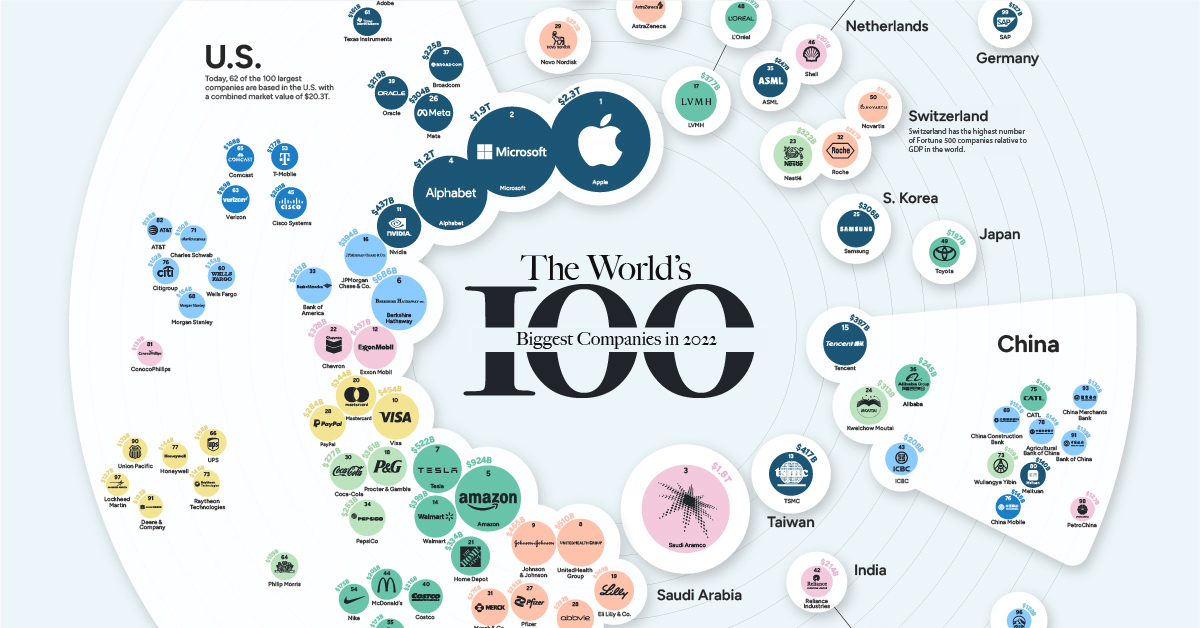
As 2022 comes to a close, the above infographic shows the biggest companies in the world, using data from Companiesmarketcap.com.
The World’s Largest Public Companies in 2022
Today, Apple stands as the world’s most valuable company, towering at a $2.3 trillion valuation.
Despite the tech downturn of 2022—driven by rising interest rates and slower sales—Apple maintained its top spot. This was largely thanks to record revenues and healthy consumer demand for iPhones, which drive about half of its total revenue.
Following Apple is Microsoft. Unlike Apple, Microsoft has faced slower earnings over the year due to lower demand for personal computers and the weighing impact of a strong U.S. dollar. Overall, about 50% of the company’s sales take place overseas.
As we show below, there are now only four companies left in the trillion dollar market cap club.
*As of Dec 12, 2022.
Oil giant Saudi Aramco is the third largest publicly-traded company globally, at $1.8 trillion. It’s also the only non-U.S. company in the top 10.
In May, the state-run company briefly became the most valuable company on the planet as soaring energy prices boosted earnings. Saudia Arabia is the largest exporter of oil in the world, and the country’s economy is forecast to grow 7.6% in 2022—one of the fastest globally.
Overall, 62 companies of the 100 largest are headquartered in the U.S., 11 are based in China, and five are located in France.
Top 10 Performance in 2022
For many of the world’s largest companies, 2022 was a brutal year for performance.
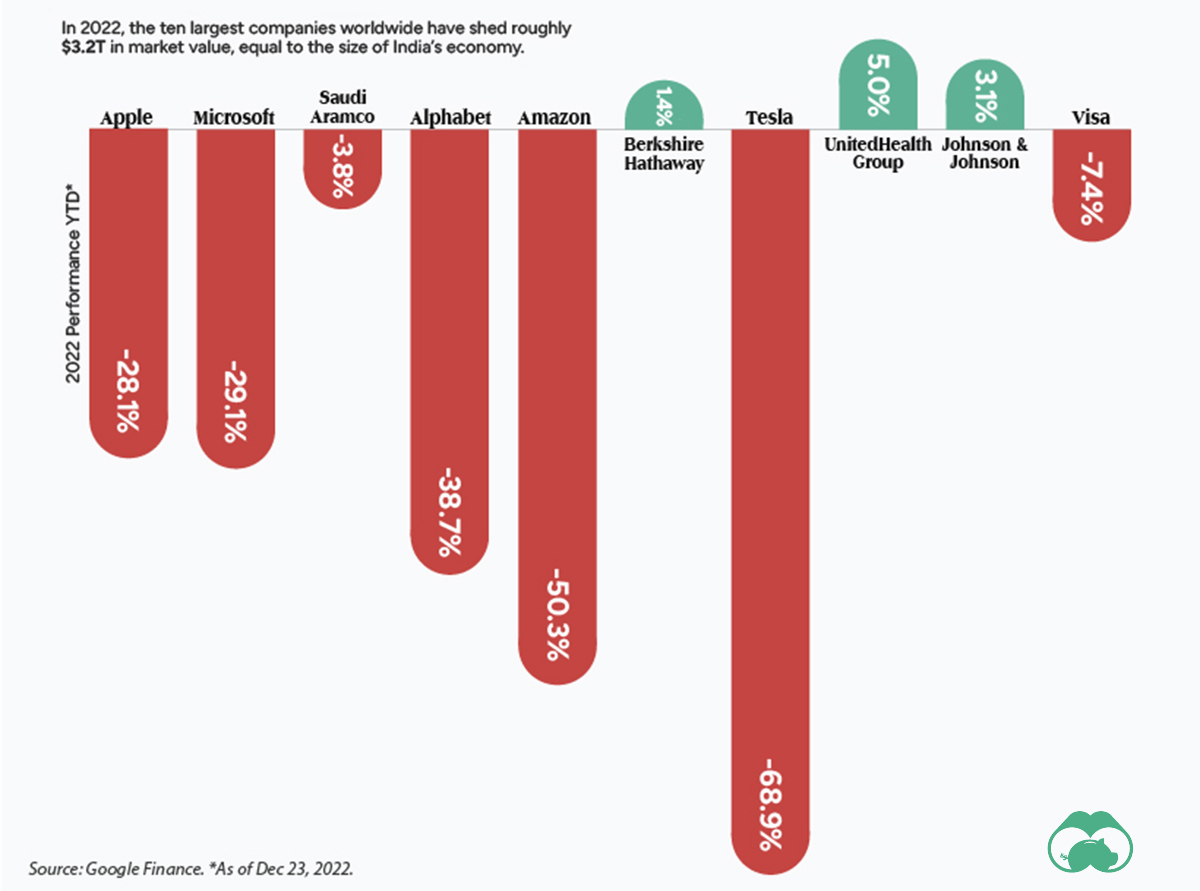
As the above graphic shows, the vast majority of the world’s titans saw their market values decline. Half of these companies saw double-digit drops.
Tesla has witnessed nearly 70% of its market cap being erased this year. Two main factors are behind this drop: falling demand, especially in China, and CEO Elon Musk’s volatile and risky acquisition of Twitter.
On the other hand, UnitedHealth Group has seen the strongest performance among the top 10.
The company, which rakes in a large share of its earnings from employer-backed insurance plans, said that recessionary impacts had not yet begun materializing in 2022.
Biggest Companies in the World, by Sector
Even with sinking market values across the sector in 2022, tech remains dominant.
Among the world’s biggest companies, 20 are in tech, spanning a combined market value of $9.2 trillion. For perspective, that’s about 31% of the market value of the 100 largest companies.
| Rank | Sector | Combined Market Value | Number of Companies | Biggest Company in Sector |
|---|---|---|---|---|
| 1 | 👩💻 Technology | $9.2T | 20 | Apple |
| 2 | 🚗 Consumer Discretionary | $4.7T | 17 | Amazon |
| 3 | 🩺 Health Care | $4.3T | 17 | UnitedHealth Group |
| 4 | 🛢️ Energy | $3.4T | 8 | Saudi Aramco |
| 5 | 💵 Financials | $3.0T | 14 | Berkshire Hathaway |
| 6 | 🏭 Industrials | $1.8T | 9 | Visa |
| 7 | 🥫 Consumer Staples | $1.8T | 7 | Procter & Gamble |
| 8 | 📞 Telecommunications | $841B | 5 | Cisco |
| 9 | ⛏️ Basic Materials | $326B | 2 | Linde |
| 10 | 🔌 Utilities | $127B | 1 | Nextera Energy |
Companies are classified according to the FTSE Russell Industry Classification Benchmark. *As of Dec 12, 2022.
Consumer discretionary and health care sectors fall next in line, with big players such as Amazon and Johnson & Johnson among their ranks.
At the other end of the spectrum is utilities, the smallest sector overall at least pertaining to the largest companies list. NextEra Energy, the sole utilities company among the rankings is one of the world’s largest developers of wind and solar energy. Over the next three years, it plans to invest up to $95 billion in greening its power operations.
Change of Fortune
It comes as no surprise that many of the biggest companies in the world are long-established players in global markets.
Yet within the rankings, some of the notable risers compared to 2021 are UnitedHealth Group, which launched from #19 in 2021 to #8 this year and NVIDIA which has climbed to become the 11th largest company globally, up from #24 last year.
By contrast, some of the biggest losers are Meta (Facebook’s parent company) and Alibaba. Meta has fallen across the rankings to #26 in 2022 from #6 in 2021. Meanwhile, Alibaba was once the ninth largest globally but has tumbled to #36. Both companies have seen considerable value wiped from their market caps—roughly 66% and 28%, respectively—amid lagging earnings.
With the year coming to a close, it remains to be seen whether the world’s biggest companies stage a comeback in 2023, or face more challenging conditions ahead.
MARKETS
Ranked: The 25 Countries Receiving the Most U.S. Immigration Visas
Every year, there are hundreds of thousands of U.S. immigration visas issued by the government. See which countries receive the most in this visualization.
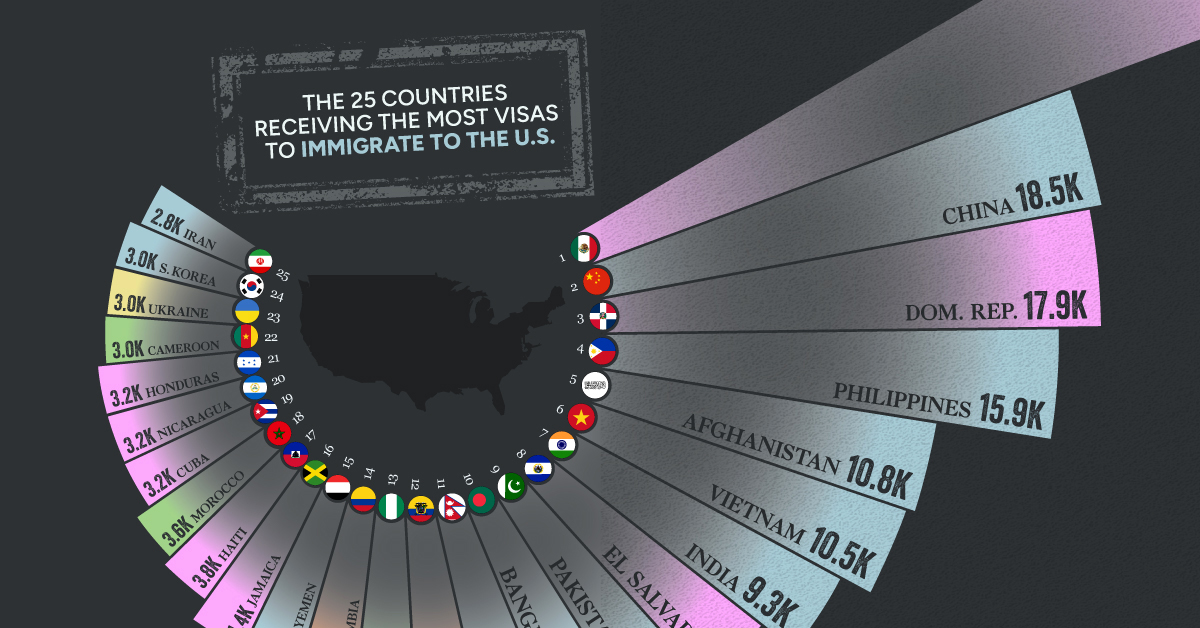
The Top 25 Countries Receiving the Most U.S. Immigration Visas
Although many Americans feel that their country is on the wrong track, this does not stop foreigners from wanting to move to the United States. For many around the globe, the promise of the American dream is still worth the permanent move and hundreds of thousands of people every year apply for their U.S. immigration visas.
The ranking uses annual data from the U.S. Department of State’s Bureau of Consular Affairs to visualize the countries whose citizens are receiving the highest number of U.S. immigrant visas.
U.S. Immigration Processes
The process of U.S. immigration is confusing at best, but it always starts with a visa. A visa, in the context of immigration, is essentially a permit to enter the country, issued to those looking to work and live in the United States. There are two visa categories: immigrant and non-immigrant.
Non-immigrant visas
These visas are typically for temporary workers, but also serve other purposes, like basic travel for tourists from certain countries. Even when obtained for work purposes however, non-immigrant visas expire and do not lead to green cards or citizenship.
Some examples of non-immigrant visas categories include: members of the press, diplomatic representatives, foreign military personnel stationed in the U.S., athletes, and a plethora of other unique situations. The popular, and nearly unattainable, H-1B visas are actually non-immigrant visas.
Immigrant visas
Immigrant visas, on the other hand, can either be employment-based or family-based. The intention behind them is that they will eventually lead to permanent status in the U.S., either through green cards or citizenship. A common example of an immigration visa is the K-1 visa or the “fiancé visa” for individuals marrying American citizens.
Who’s Getting U.S. Immigrant Visas?
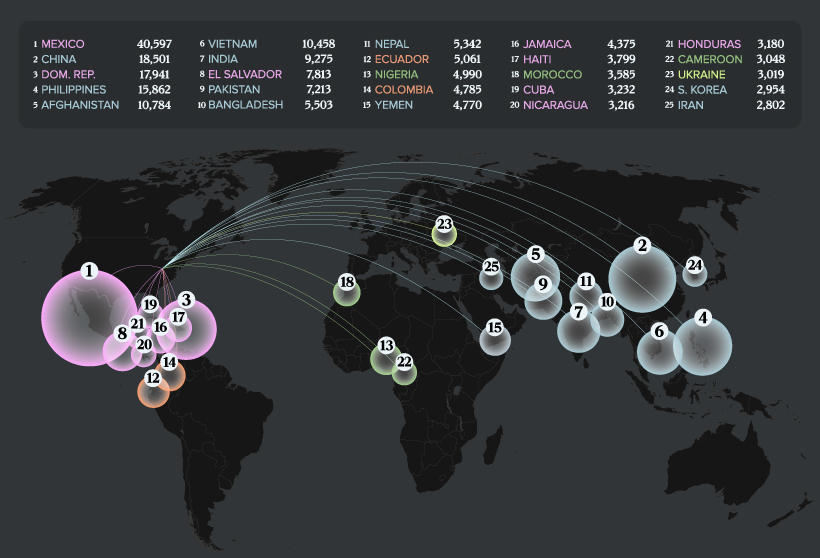
Last year, more than 285,000 U.S. immigrant visas were issued. Here’s a look how that is distributed across every country worldwide:
| Rank | Country | Immigrant Visas Issued (2021) |
|---|---|---|
| #1 | 🇲🇽 Mexico | 40,597 |
| #2 | 🇨🇳 China | 18,501 |
| #3 | 🇩🇴 Dominican Republic | 17,941 |
| #4 | 🇵🇭 Philippines | 15,862 |
| #5 | 🇦🇫 Afghanistan | 10,784 |
| #6 | 🇻🇳 Vietnam | 10,458 |
| #7 | 🇮🇳 India | 9,275 |
| #8 | 🇸🇻 El Salvador | 7,813 |
| #9 | 🇵🇰 Pakistan | 7,213 |
| #10 | 🇧🇩 Bangladesh | 5,503 |
| Total | 285,069 |
Mexican citizens received the highest number of visas to immigrate permanently to the U.S. at nearly 40,600. America’s other neighbor, Canada, ranked 43rd, only receiving 1,464 visas. China and India also rank high on the list, ranking at #2 and #7 respectively.
Interestingly, only one European country, Ukraine, made the top 25. In 2021, prior to the Russian invasion, Ukrainians obtained 3,019 visas. A number of the top visa recipient nations are marked by violence and political unrest, like Afghanistan (#5) and Iran (#25).
Looking beyond the top 25, one surprising find is that eight North Korean citizens received immigration visas last year. Additionally, a number of countries only received a handful of U.S. immigrant visas including Luxembourg’s two, and Timor-Leste’s one.
Regionally, the bulk of the highest ranking countries are located in Asia. Here’s a breakdown:
| Rank | Region | Immigrant Visas Issued (2021) |
|---|---|---|
| #1 | Asia | 111,419 |
| #2 | North America | 91,919 |
| #3 | Africa | 35,776 |
| #4 | Europe | 23,972 |
| #5 | South America | 20,688 |
| #6 | Oceania | 1,295 |
Finally, here’s the geographical distribution of persons receiving U.S. immigrant visas.
The State of U.S. Immigration
Around 15% of the U.S. population is made up of immigrants, and the country is home to the highest number of total immigrants in the world, at 50.6 million.
In terms of how many visas are issued annually, there is a federal ceiling of 700,000 and certain countries have their own specific caps on how many their citizens can receive, as mandated by the United States. Although the numbers change drastically year by year, they have not come close to the limit in the last decade.
Here’s a look at the total U.S. immigrant visa issuances globally. Notably, they diminished by almost half during the pandemic:
| Year | Immigrant Visas Issued Worldwide | % Change Year-over-Year |
|---|---|---|
| 2012 | 482,300 | – |
| 2013 | 473,115 | -1.9% |
| 2014 | 467,370 | -1.2% |
| 2015 | 531,463 | +13.7% |
| 2016 | 617,752 | +16.2% |
| 2017 | 559,536 | -9.4% |
| 2018 | 533,557 | -4.6% |
| 2019 | 462,422 | -13.3% |
| 2020 | 240,526 | -48.0% |
| 2021 | 285,069 | +18.5% |
Overall, whether for economic purposes, reunification of families, or in fleeing from danger, people are continuing to come to the United States.
In the period between 2016 and 2060, it’s expected that the share of the U.S. population that is American-born is going to grow by 20%. Meanwhile, the share of the population that is foreign-born is expected to jump by 58%.